

Guess what day most people lose their streak!

Hey ProductHunt!
Trophy is now powering over 24M streaks which is kind of crazy to think about considering we only launched 1.0 here in January this year.
One of the parts I find most interesting about building horizontal infrastructure is that as you scale and power more and more products you get to see insights that most teams building in isolation will only see a part of, and you can use those insights to make the the infrastructure better for everyone.
For example, because we power streaks for so many users, Trophy can tell that 25% of all streaks are lost on a Friday, closely followed by Saturday (19%) and then Wednesday (18%).
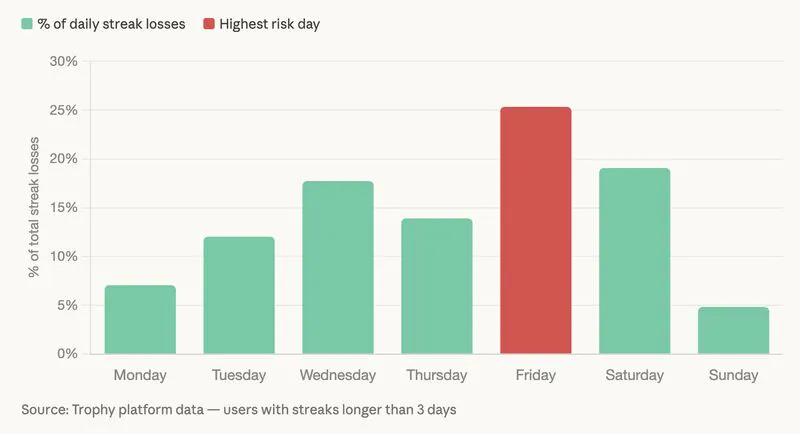
This is across all products Trophy powers, but we can use this to back up insights for each products specific use case and start powering advanced features for them.
The most obvious next step from here is to start working on improving our streak infrastructure to personalize streaks reminders for each user, including sending targeted reminders based on when each user is most likely to lose their streak.
Lot's more insights like this to follow!
Happy building!
Charlie
Replies
Just out of curiosity – do you know the cause?
@busmark_w_nika As this looks across all the products we support it's difficult to point to one specific cause. Our customers are mostly consumer-focused mobile and web apps, and usage patterns tend to vary by industry. Edtech for example gets more usage during the week when people are studying, whereas other types of platforms like gaming tend to be busier during the weekend when people are a bit more chill. As we scale we plan to break this down by industry, and I expect the patterns and causes will become clearer.
@charlie_hb I think it would be useful to see the reasons (so I would know what to avoid) :D
25% on Fridays makes sense. That is when the week mentally ends for most people, even if the calendar does not.
We are building around a similar problem, not streaks, but the habit of recording expenses at the moment they happen. The twist: everything runs on-device, so we actually cannot see our own users drop-off patterns. Privacy by design, blind spot by design.
That 24M data set must tell a story most of us building habit-dependent products would pay to read.
25% on Fridays actually makes a lot of sense, motivation drops right when people “switch off”.
Streak systems are way more about timing psychology than people think.
@judit10 Exactly right, that's why peronsalization of experience is so important.
This is the kind of insight that only becomes visible when you reach real scale. 24M streaks gives you a dataset most apps will never have, and Friday being the biggest drop day makes a lot of behavioral sense when you think about it.
The week structure creates a mental reset. People are usually disciplined early in the week, then the weekend mindset starts creeping in on Thursday and Friday. "I'll restart Monday" is a very human thought.
What surprises me is Wednesday at 18%. That feels like the mid-week energy dip that researchers find in productivity data too. The "hump" in hump day is real.
Building at ad-vertly we see something similar in marketing task completion. Mondays are high-intent, Fridays are avoidance. The personalized reminder angle you mentioned is exactly the right call. Generic nudges do not move the needle but well-timed, contextual ones do.
This is quite interesting. Have you pinned the most common reasons?
Friday makes so much sense - the week is done, the discipline loosens, and the habit that felt automatic Mon-Thu suddenly feels optional. The Wednesday spike is more interesting to me - mid-week energy crash? I see something similar with Hello Aria users (AI productivity assistant via WhatsApp). Engagement dips mid-week if there is no anchoring trigger like a meeting or deadline. The products that beat this seem to do two things: make the streak feel like a running tab rather than a daily checkbox, and build social accountability into the experience. Curious if you found that streak loss is more about forgetting vs deciding to skip?