

Why visual sales charts motivate store owners more than raw rows of numbers.
by•
Numbers in rows can feel exhausting. Visual charts clearly show sales spikes, top products, and monthly growth instantly.
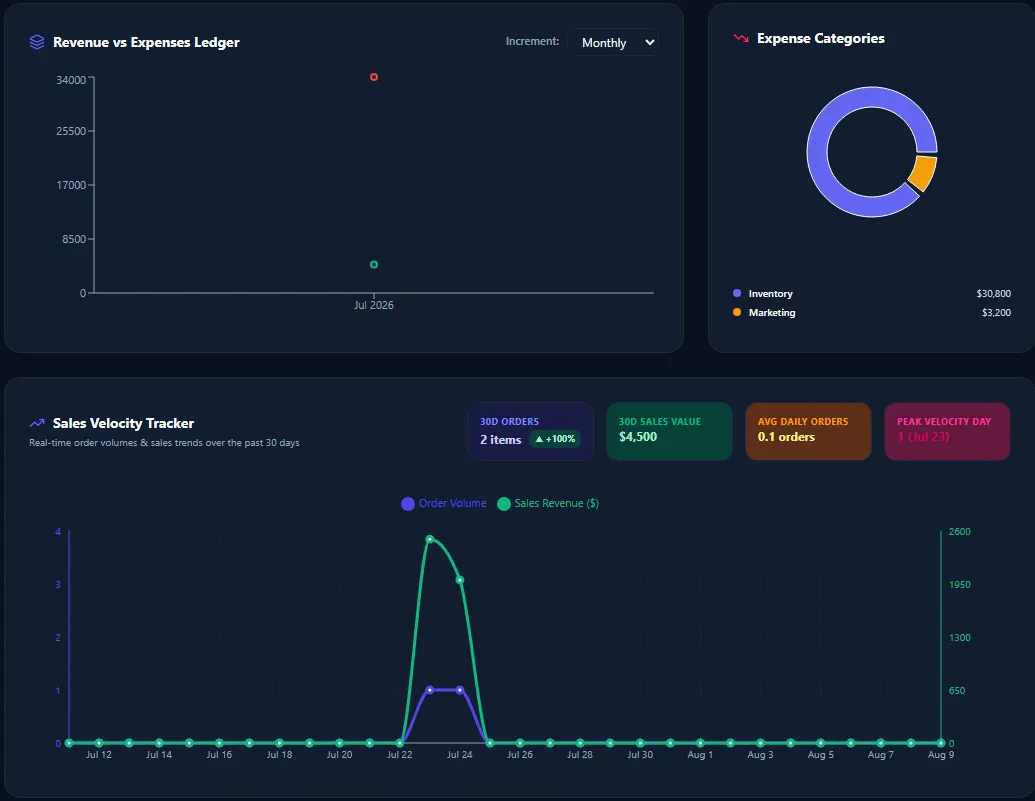
See how SME Smart Suite visualizes business performance
2 views
Replies
Be the first to reply
Have a question or a thought to share? Add a comment above to start the conversation.