
Launching today

Embedful
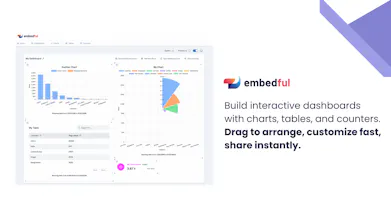
Easy data visualizations. Embed and share anywhere.
179 followers
Easy data visualizations. Embed and share anywhere.
179 followers
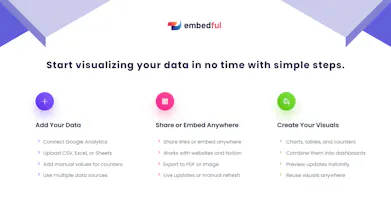
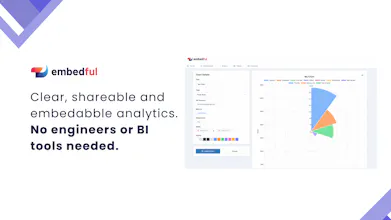
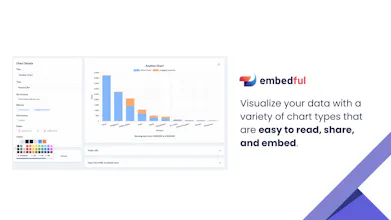
Embedful turns analytics into a feature your customers can see and interact with. Build charts, tables, counters, and dashboards in minutes using Google Analytics, Google Sheets, Excel, CSV files or APIs, and share them instantly. Visualizations are interactive by default, and branding can be tailored with your logo and theme colors. They can then be embedded or shared anywhere, making analytics simple and engaging for every user.


Embedful
Hello Product Hunt 👋 I'm Fernan, the founder of Embedful.
We created Embedful to solve a common problem product teams face when trying to show analytics to their users. Most existing tools either have a steep learning curve, are too specialized for analysts or developers, are expensive, or require significant engineering work just to embed a chart, table, or dashboard.
Embedful makes customer-facing analytics simple and easy. You can create beautiful, interactive charts, tables, counters, and dashboards in minutes using Google Analytics, Google Sheets, Excel, CSV files and APIs. Everything is fully embeddable and shareable. Even non-technical users can visualize data with a few clicks and customize dashboard layouts with drag-and-drop simplicity.
We built Embedful to be fast, flexible, and product-ready from day one. I'm excited to share it with the Product Hunt community and would love your honest feedback.
I will be here to answer any questions! Thank you in advance!
@fernan_de_dios Congratulations on the launch. What's one underrated integration you've seen drive the most value for non-technical PMs embedding analytics, and how does Embedful make it dead simple?
Embedful
@swati_paliwal Thanks! That’s actually a question I get asked quite a bit. One underrated integration that consistently drives value for non-technical PMs is Google Sheets and Excel.
A lot of PMs already live in spreadsheets, whether it is tracking experiments, campaign data, or stitching data from different tools. The real value is turning that raw data into clear visuals that are easy to understand and access anywhere.
With Embedful, you paste a public Sheets link or upload an Excel file, we turn it into clean visuals, and give you a embed link for Notion, Coda or the like, or a short embed code for websites and other platforms. You can manually update an Excel file or set an automatic refresh interval for Google Sheets and similar sources, so everything stays updated wherever it is embedded. No APIs or setup needed.
Hedy AI
How flexible is the embedding layer? Can teams control permissions, user-level data visibility, or dynamic filtering per user?
Embedful
@kate_sleeman Great question. Right now, the embedding layer is intentionally pretty lightweight and flexible.
At the moment, fine-grained controls like user-level permissions, data visibility, or per-user dynamic filtering are not built into individual embeds yet. Embeds are designed to be easy to share and drop into tools like Notion or websites without much setup.
For access control, dashboards currently support password protection, which is where most teams handle gated sharing today. For individual embed elements, we do not have password protection yet, but it is something we are considering adding if there is strong demand.
The focus so far has been simplicity and speed, but more advanced controls are definitely on the radar as more teams start using embeds in production environments.
The Examiners: E-Learning Platform
Really like this idea. Being able to update data using just a connected Google sheet is a great time saver. Any way to integrate with zapier?
Embedful
@joe_worrall Thanks! Not yet, but Zapier is on our roadmap along with more integrations with other platforms.
Congrats on the launch! I've been living in Notion and Google Sheets and knowing I can pull both into one embeddable dashboard is huge! Can you connect multiple data sources to a single visualization?
Embedful
@aya_vlasoff Thanks, really appreciate that! Great question too. Right now, you can bring different data sources together within a single dashboard and visualize them side by side, but combining multiple sources into a single visualization is not supported yet.
That said, it is a great idea and definitely something we can explore as we continue building!
Congrats! We've been looking for a way to share clean dashboards with investors and partners without giving them access to our internal tools. Does the data refresh in real-time when the source sheet updates, or is there a delay? And can you password-protect individual embeds, not just full dashboards?
Embedful
@ben_gend Thanks, really appreciate it and great use case. For updates, you can either manually refresh on the Embedful platform or set a regular automatic interval. Once refreshed, your embeds update everywhere they are placed, so investors and partners always see the latest version without extra work.
And yes, password-protecting individual embeds is a pretty popular request. Right now, protection is at the dashboard level, but this is something we will definitely bump up on the roadmap based on feedback like this!
Clipboard Canvas v2.0
The branding customization is a nice touch too; nothing feels worse than sharing insights that lack a cohesive look. Curious, how do you handle performance when embedding large datasets?
Embedful
@trydoff Thanks, happy to hear that! Great question. Right now, we keep things performant by keeping datasets to around 500–1,000 rows per source. This tends to be the sweet spot for both visual clarity and performance, making sure charts stay fast, responsive, and easy to understand.
The goal is to avoid clutter while still giving enough data to be meaningful. If there is growing demand for larger datasets, it is definitely something we can explore and optimize for over time.
Congrats on the launch! The embedded analytics angle is smart; most tools make you send users somewhere else to see their data when it should just live inside the product.
With CoreSight, we generate a lot of structured financial output, and the question of how to make it visually digestible without a heavy engineering lift is something we think about. Does Embedful handle data that updates in real time, or is it more suited to static snapshots?
Embedful
@andreitudor14 Thanks, really appreciate the question! Right now, Embedful supports both manual refresh and scheduled automatic updates. You can either trigger a refresh yourself on the platform or set an automatic interval (as frequent as every 15 minutes) so your embedded analytics stay up to date.
That way, your visuals can behave more like near real-time dashboards when needed, while still staying lightweight and easy to manage.