

📊 Netfox now speaks Prometheus → chart your network in Grafana (v0.8.0)

Hey everyone 👋
Netfox 0.8.0 is out, and it ships something that came straight from this community: a Prometheus-compatible metrics endpoint. 📈
🙏 Huge thanks to @angsak6 — you asked us to expose Netfox's data to Prometheus so you could chart it in Grafana next to the rest of your homelab. Here it is. 🦊
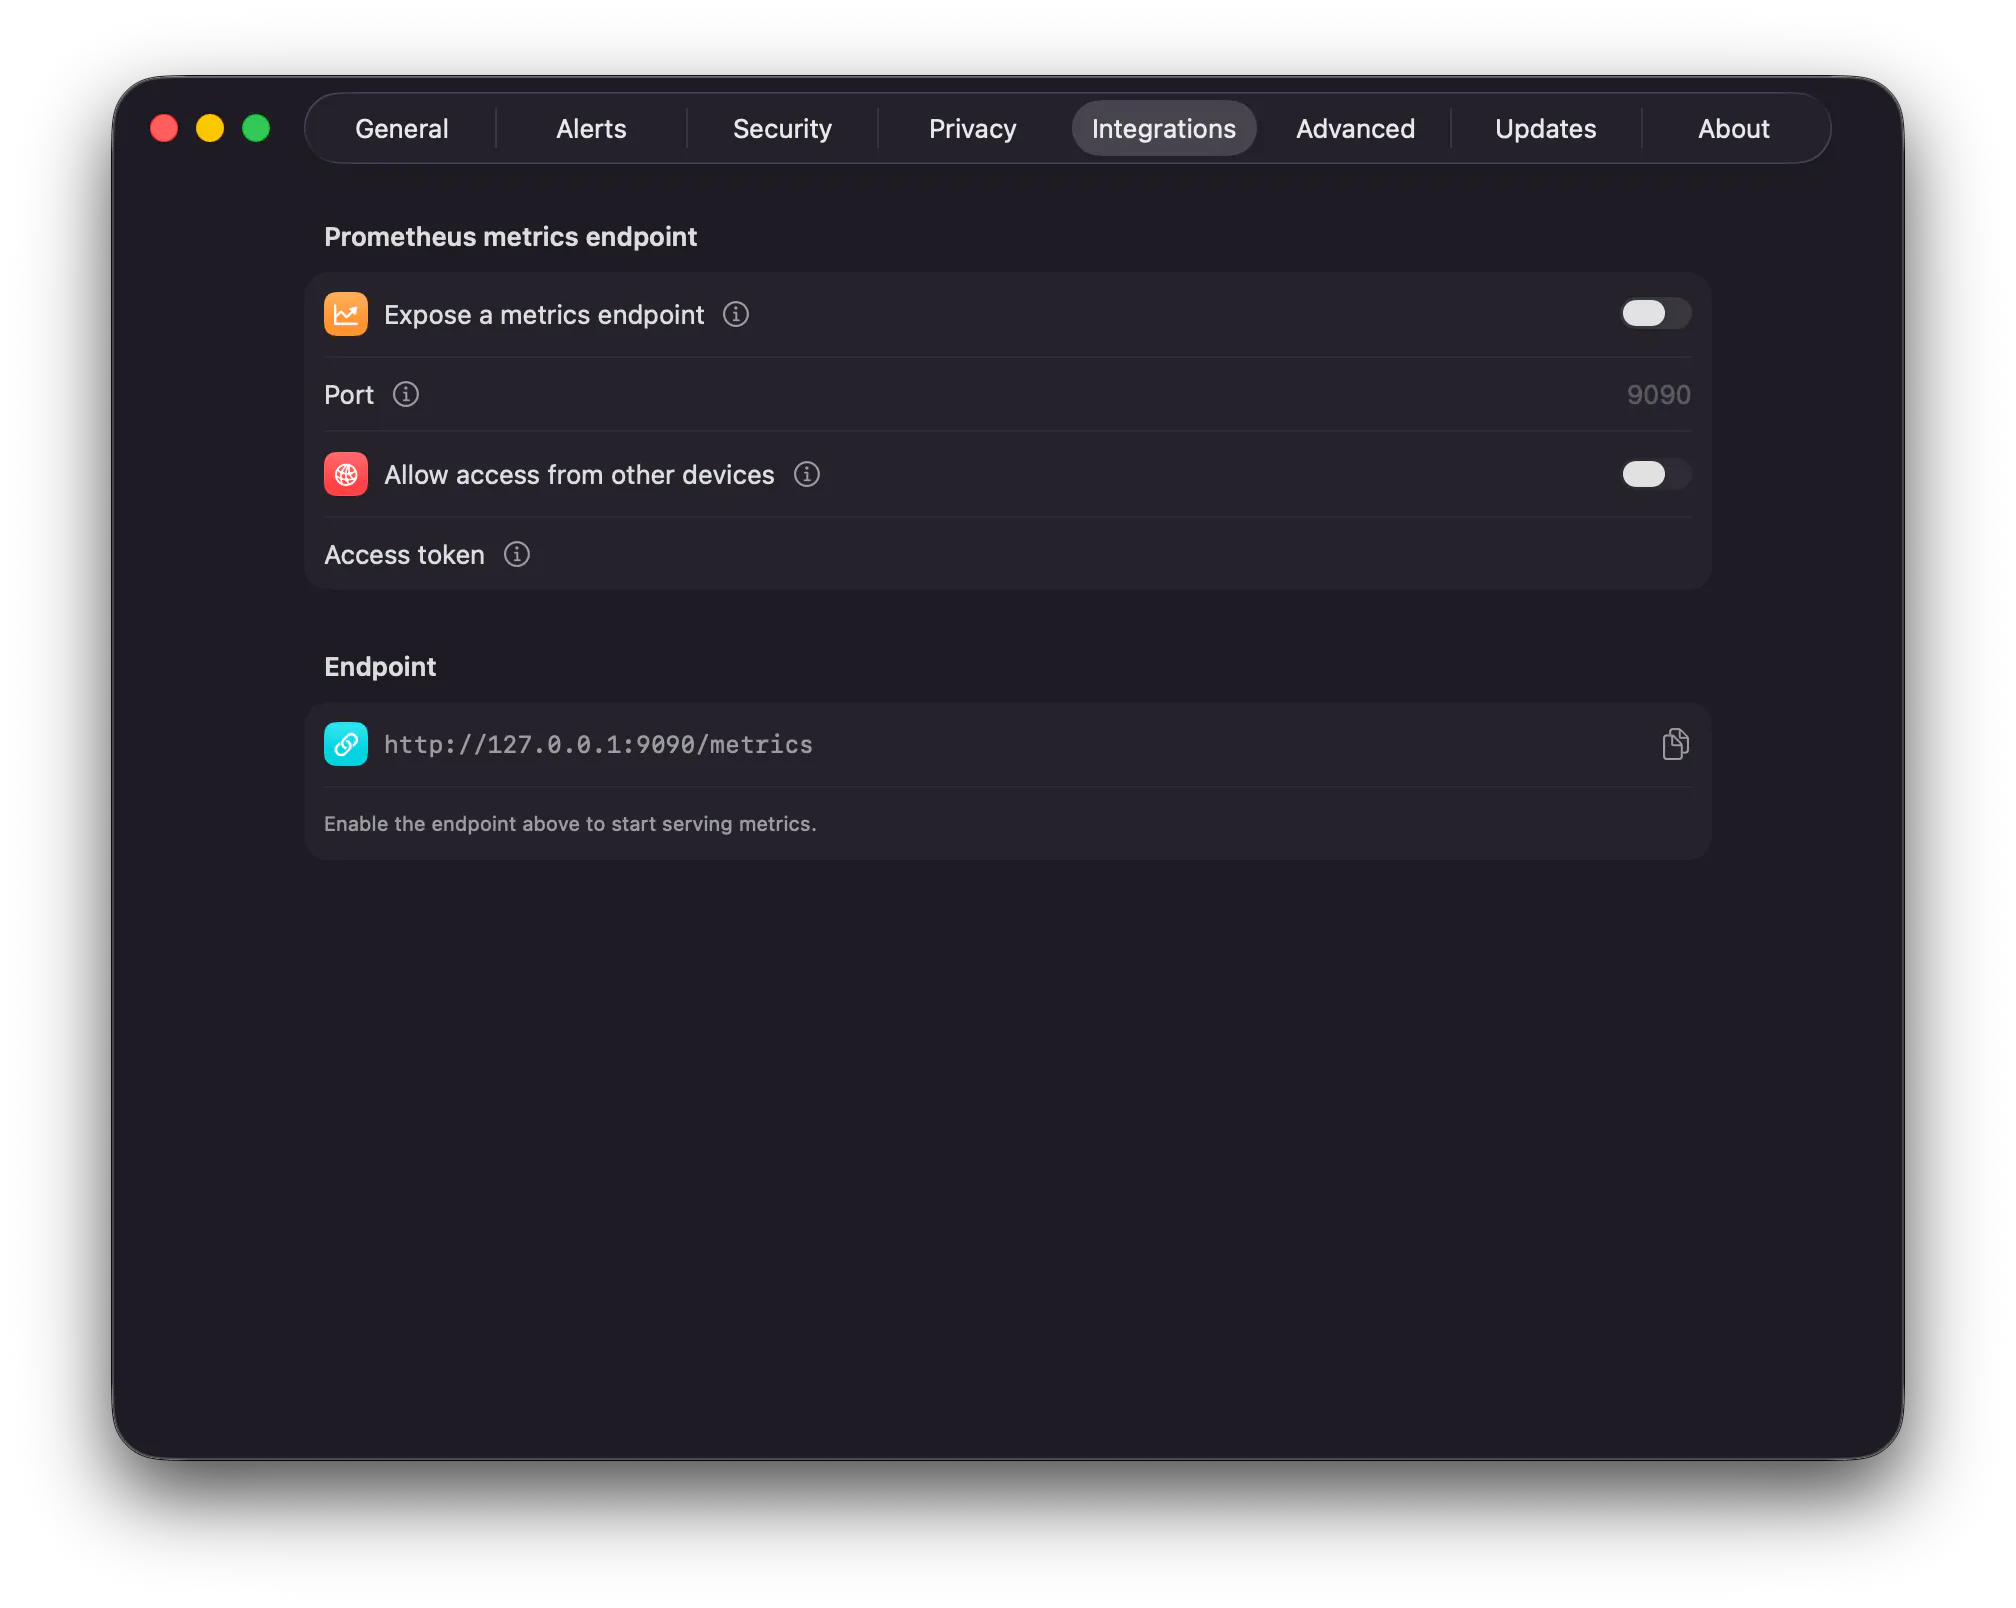
⚡ Turn it on in Settings → Integrations and Netfox serves /metrics in the Prometheus text format. Point
Prometheus at it, drop the series into Grafana, done.
📊 What it exposes
- 🔌 Open ports per host (plus an open-port count)
- 🕒 When each port's state was last observed
- 🟢 Device state — online / offline — and last-seen time per device
- 📶 This Mac's network throughput (rx / tx)
- 🔔 Alert counts by type
🔒 Off by default, yours to expose
- Off by default — nothing listens until you opt in
- Localhost-only, unless you flip it to your LAN (so a Prometheus on your NAS can scrape it)
- Optional bearer token
- Live whenever Netfox is running — it stays in the menu bar, serving with the window closed
📚 Setup, the full metric list, and a sample scrape config: https://netfox.app/docs/integrations
⬇️ Download / update: https://github.com/gfazioli/netfox-website/releases/tag/v0.8.0 (or Netfox → Check for Updates…)
If you run Prometheus + Grafana at home, give it a spin and share your dashboards — I'd love to see them. 📸 And keep the requests coming: this one went from idea to shipped because someone asked. 🙌
Replies
This is exactly the kind of integration homelab folks have been wanting. Scraping Netfox metrics into Grafana right next to Proxmox and Uptime Kuma? That's a genuinely useful dashboard. Setting this up tonight.
Netfox
@ivan_stakhov Love this 🙌 That's exactly the picture we had in mind — Netfox sitting in the same Grafana as Proxmox and Uptime Kuma.
To make tonight quick, the docs have a ready-to-paste scrape config and the full metric list: https://netfox.app/docs/integrations
One tip, since you'll probably scrape from another box: flip on Allow access from other devices and set an access token in Settings → Integrations 🔒 — then point Prometheus at http://:9090/metrics.
Would genuinely love to see the dashboard once it's live — drop a screenshot if you're up for it 📸
@gfazioli Got it working last night! The scrape config in the docs was super clean, and the access token tip saved me from a lot of trial and error. Dashboard is up right next to Proxmox and Uptime Kuma, fits perfectly in the stack.
Netfox
@ivan_stakhov Amazing! that just made my day 🙌 Exactly the stack I was hoping it’d slot into. So glad the token tip saved you the trial-and-error 😉
@gfazioli Will definitely drop a screenshot! Seeing network latency alongside Proxmox CPU and Uptime Kuma status all in one view is really satisfying - it's become one of the most-checked panels on my homelab dashboard.