

How to build a self-healing agent loop

A few weeks ago, one of our developers pushed a refactor touching one of the agents Latitude runs in production. It looked harmless in review. Every request kept going through and latency stayed flat, but the prompt cache hit rate (how often an AI successfully reuses its cache instead of rereading information), which is normally above 80 percent, fell to 30. For perspective, cache reads cost about a tenth of what fresh input tokens do, so the drop tripled our effective token spend on the same traffic.
Thankfully, a monitor in Latitude was watching that rate and the drop opened an incident which, in turn, dispatched Claude Code in the cloud, and a few minutes later a pull request appeared that restored the cache structure the refactor had broken. A developer reviewed the change, merged it, and the hit rate recovered within the hour.
Without that loop, a regression like this tends to pop up weeks later in a cost report, and someone spends an afternoon dissecting deploys to find it. Latitude was built around the idea that the system watching an agent should be able to hand its evidence to the system that writes the fix.
This is the loop:
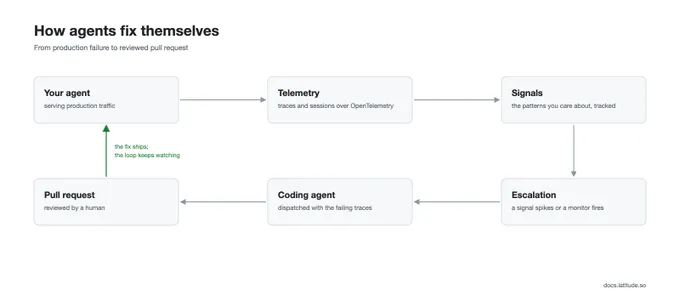
And this is how to wire it up for your own agent.
1. Instrument the agent
The loop begins with seeing everything. Point your agent's OpenTelemetry exporter at Latitude and every interaction arrives as a trace, carrying the model calls, tool calls, retrieved context, latency, and cost. Related traces group into sessions, so a ten-turn conversation is a single object rather than ten disconnected rows. If your agent emits OpenTelemetry today, as most do, this is a new endpoint rather than a rewrite.
2. Find a failure worth fixing
You now have more conversations than anyone will read, and keyword search will not find the bad ones, because users do not fail in exact strings. Search works by meaning or 'semantics' instead. "Checkout" returns the matching conversations related to checkout however they were phrased, and full coverage stays affordable because agent traffic has a lot of repetition. The same prompts and tool outputs recur thousands of times a day, and each unique message is embedded once no matter how many traces contain it.
For the failures you would not think to search for, Behaviors cluster sessions by what the user was trying to do, and each topic carries a trend against the week before it. When password-reset loops start spiking, the change shows up as a status before anyone has gone looking for it.
3. Annotate what you find
Whatever you find will evaporate when the tab closes unless it is recorded where the system can see it. Leave a thumbs-down with specific feedback ("quoted a version we never shipped") on the exact offending message; that is the strongest signal you can give the system, and automatic flaggers do the same job for common failure categories without waiting for a human. A handful of annotations is enough to get the ball rolling.
4. Track it as a Signal
Now fear not, nobody has to organize that feedback by hand. Each new annotation is compared against the Signals that already exist and is filed under one of them or starts a new Signal with a generated name. A scatter of annotations from three teammates converges on a single tracked pattern instead of remaining disconnected complaints.
A Signal is any pattern worth following across production, a durable entity with a name, a description, member sessions, and a lifecycle. It is new for its first week, escalating while its counts are above normal, and ongoing otherwise. If it goes quiet and comes back, the same detection escalates it again.
5. Generate the evaluation
A Signal's counts are only as current as its last review, and nobody is going to reread every new conversation. That tedious work goes to a machine judge. An evaluation is a small script that scores live traffic and can mix three kinds of rules in whatever combination fits the pattern: plain code checks, semantic similarity against a phrase, and LLM judgment where a rule cannot decide. Simple ones come from a criteria prompt or a set of conditions, and the advanced path is writing the script yourself.
For Signals born from annotations, Latitude can generate the script instead. GEPA, an evolutionary optimizer, takes your annotations as examples, tests script variants against them, and keeps the one that agrees with the human verdicts most. The finished judge carries its agreement record, which makes its reliability a measured number, and as new annotations arrive the agreement is remeasured and the script re-optimized if it drops.
6. Turn on dispatch
Detection without action is just a dashboard that knows things which is great but a dashboard does not fix an agent. Escalation is judged against the Signal's own history. The last day of occurrences is compared with the same hours over the week before, which lets a growing pattern stand out from ordinary daily rhythm. Monitors use the same mechanism for anything else worth watching, a saved search or a raw traffic metric, which is how the cache-hit-rate drop in the opening reached a coding agent.
Configure dispatch once, under Settings → Integrations, with Claude Code, Cursor, Linear, or a webhook as the target. When a Signal escalates or a monitor opens an incident, the coding agent is woken up with a small payload, a prompt, a deep link, and examples of the failing traffic. Latitude is the trigger and the context provider rather than the agent runtime; the dispatched agent runs in your environment, with your credentials, against your repository. It investigates the way an engineer would, reading the Signal and its trend, slicing occurrences to find where they concentrate, and reading the failing conversations, then it fixes the agent's code or prompts, runs the project's checks, and opens a pull request.
7. Lock the fix in CI
A fix from a coding agent has to prove that it works. The failing traffic behind the Signal becomes a dataset, and a regression test in your repository, not in Latitude, replays that dataset against the agent as an ordinary CI check on every pull request. The fix has to pass it to merge, and so does every prompt change that comes after.
When Latitude ran the loop on its own support agent, the first fix the coding agent proposed looked reasonable and failed the regression check on its own pull request; only the second, which cleared every replayed trace, went in. The monitor keeps watching live traffic in the meantime, so if the failure returns, the Signal escalates again and the loop starts over.
Where you fit in the loop
Humans remain in two places by design. Annotations are the ground truth every evaluation is optimized against, and a person reviews every pull request before it merges. Everything between those two points, the example-hunting, the context reconstruction, the judgment call about whether a failure is recurring, the trace ids carried from a dashboard into a ticket into an editor, is what got automated.
A failure that would once have become a ticket in someone's backlog now arrives as a pull request waiting for review.
Start the loop with the MCP
Getting started is super easy just connect the Latitude MCP to your coding agent and give it this article as a catalyst. The MCP can do everything that can be done through the application UI. Claude code command here:
bash
claude mcp add --transport http latitude https://api.latitude.so/v1/mcpFor other coding agents refer to our docs:
https://docs.latitude.so/getting-started/mcp
Latitude is MIT-licensed, self-hostable, and the whole workspace is exposed over MCP.
Replies
Be the first to reply
Have a question or a thought to share? Add a comment above to start the conversation.