
octoscope
Your GitHub profile as a live terminal dashboard
86 followers
Your GitHub profile as a live terminal dashboard
86 followers
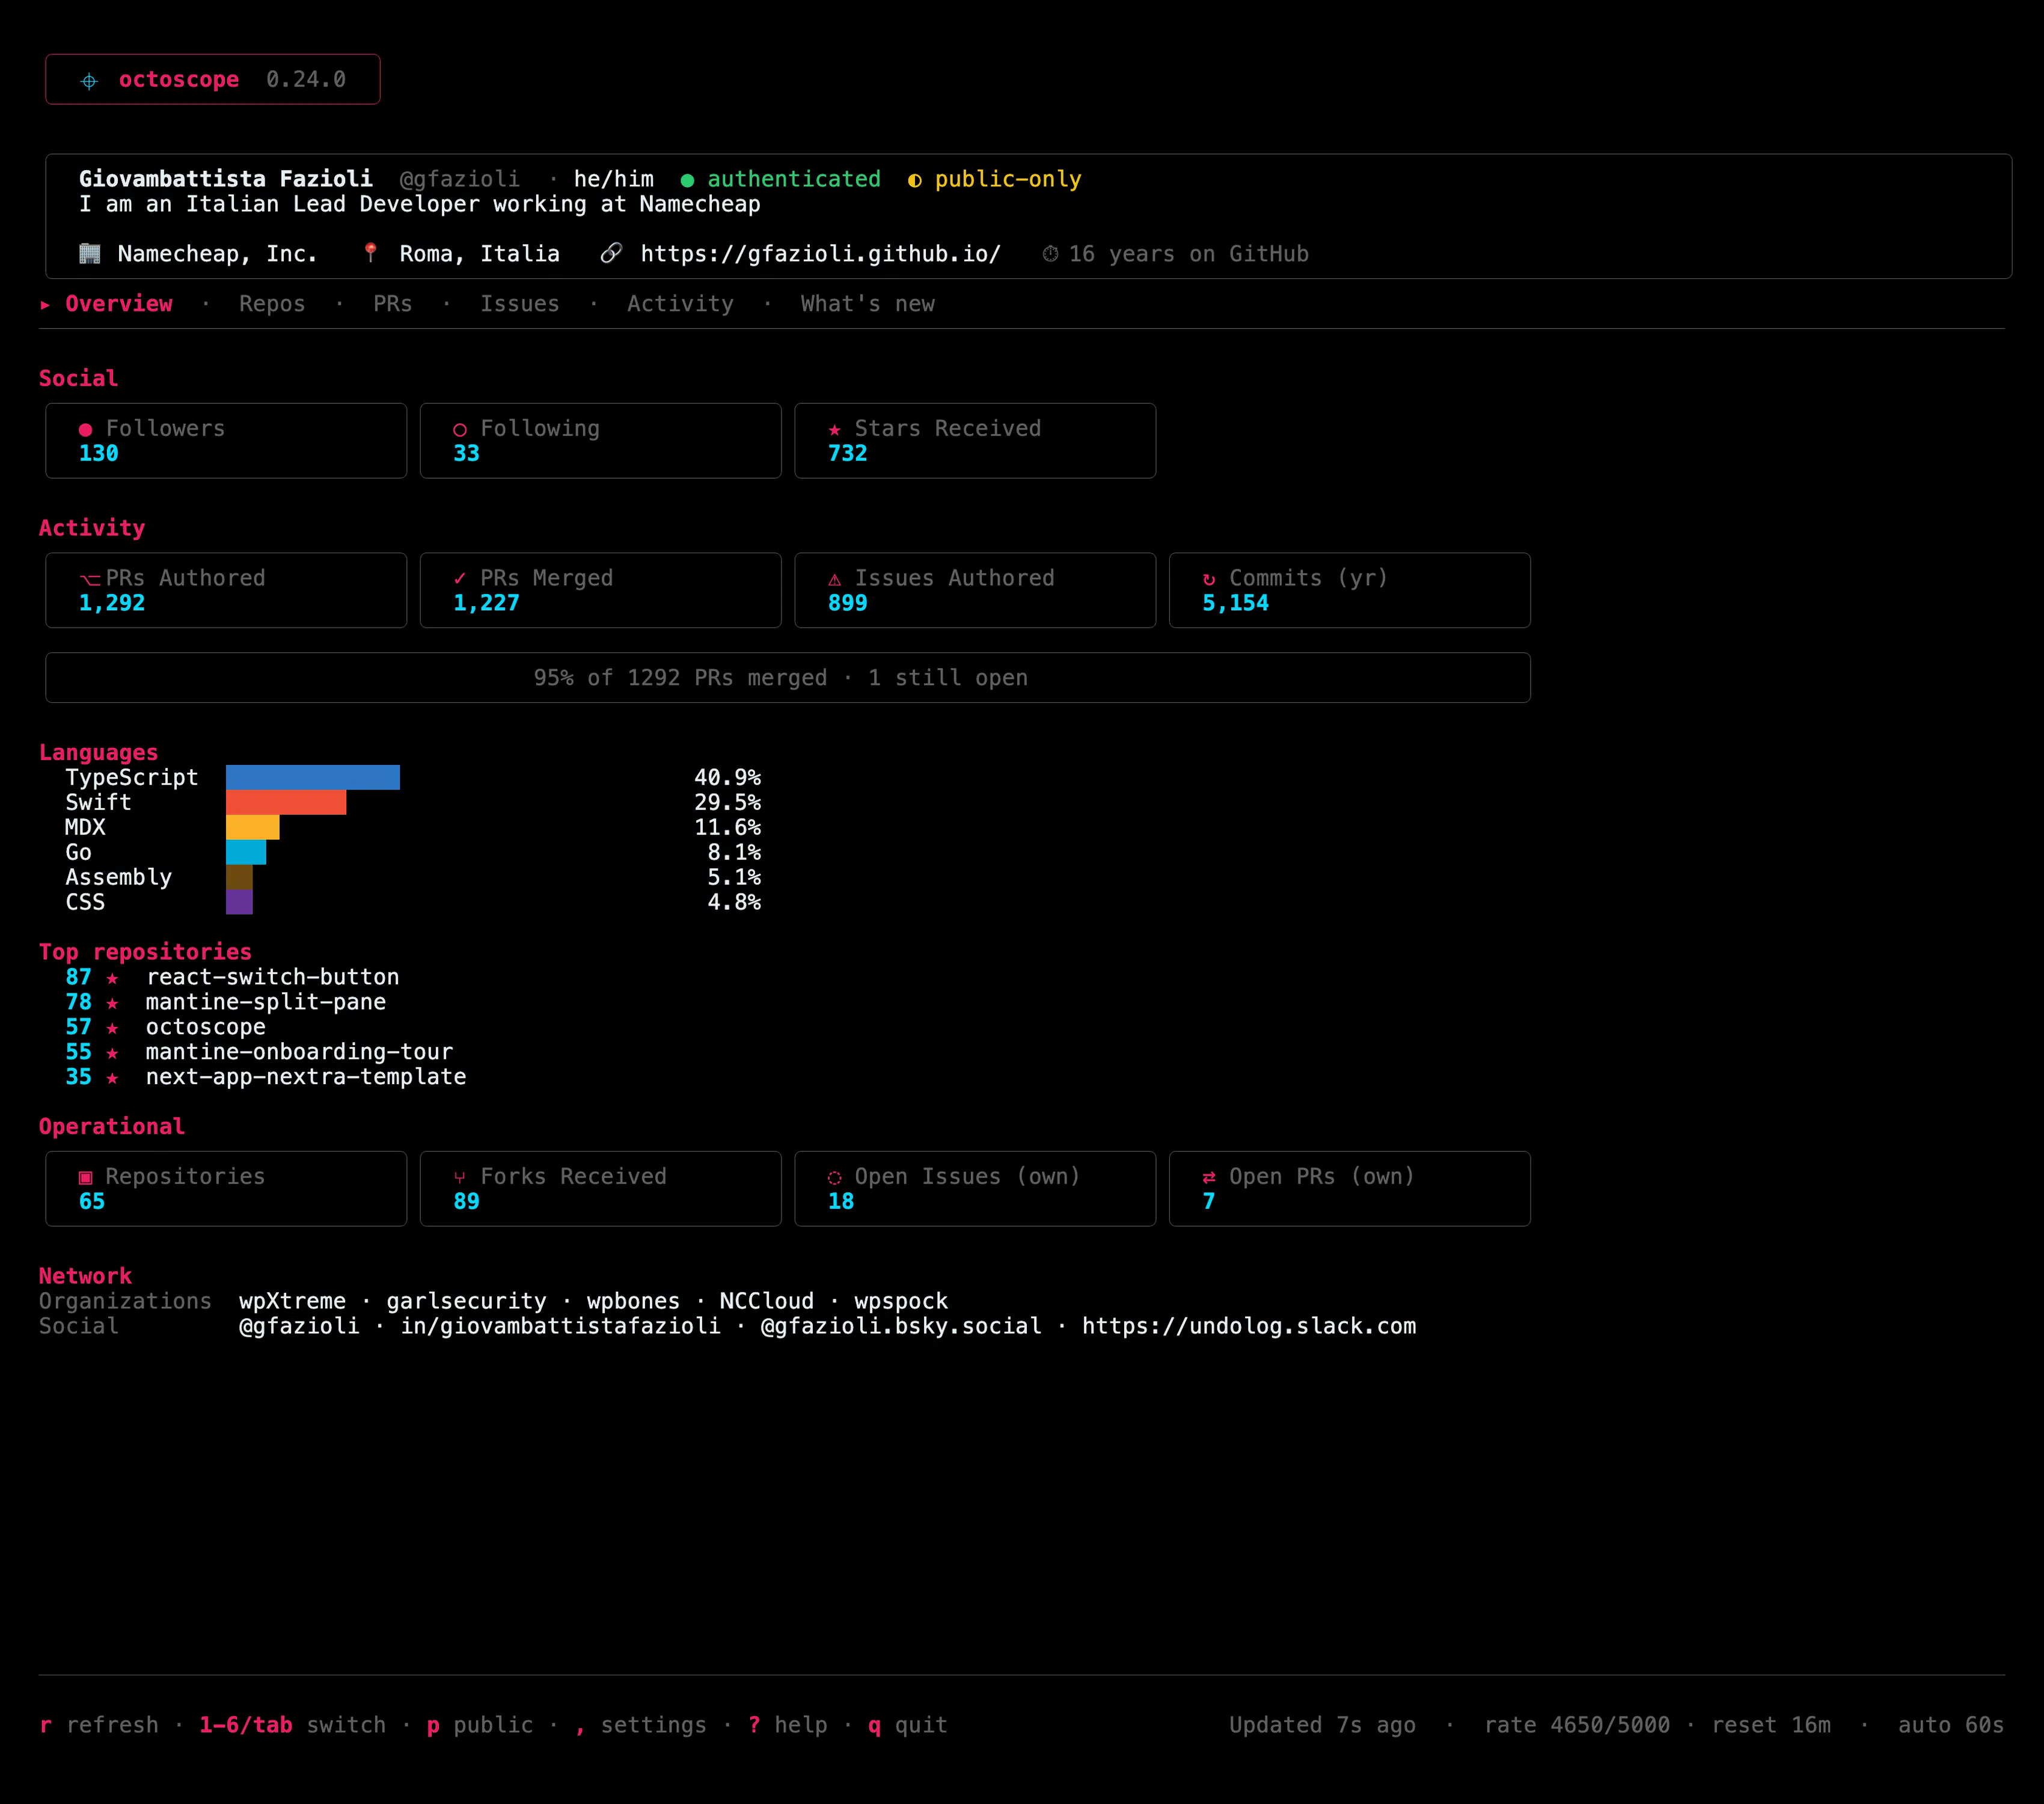
Octoscope is a native terminal dashboard that pulls your GitHub profile, activity, repo health, and network from the GraphQL API — and keeps everything auto-refreshed every 60 seconds. See PRs, issues, commits, languages, stars, followers, and org memberships at a glance. Works for your own account or any public profile: octoscope torvalds. Built in Go with BubbleTea. Open source, MIT-licensed. Install via Homebrew or go install.


Netfox
Kilo Code
@gfazioli neat product - keep up the great work!
Netfox
@fmerian Thanks! Glad you like it — if you ever try it on your GitHub profile, let me know what you think 🙏
60 second refresh on the GraphQL API gets tight fast once you're watching an active profile, especially with the 2000 points per minute secondary limit kicking in alongside the 5000 per hour primary. Are multiple octoscope windows pooling requests across a single token, or does each panel hit the API on its own schedule, and does the dashboard surface anything when the token gets throttled so the data doesn't go silently stale?
Netfox
@myultidev Thanks for the depth on this one — walked through the code to make sure I'm giving you accurate answers, not hand-waving.
Request schedule — one GraphQL query per refresh cycle, not per panel. Every section on the dashboard (Social, Activity, Operational, Network, plus the Activity-tab heatmap since v0.6.0) is populated from the same round-trip. That's a hard design rule for octoscope, baked into our internal principles.
Pooling across instances — no pooling today. Each running instance consumes the token's budget independently. The good news: with 5000 primary points/hour and a measured cost of ~1–2 points per refresh, you can run ~40 instances in parallel at the 60s cadence before the primary ceiling becomes the bottleneck. Secondary limits would show up sooner if you had many instances with unluckily aligned refresh ticks, but at 60s that's unlikely in steady state.
Throttle visibility — partial, and you're right that it could be better. The footer flips to stale — last refresh errored (in red) the moment a refresh fails, and the last-good numbers stay on screen so nothing goes silently stale. But we don't distinguish a 429 from a DNS blip yet — a specific "rate-limited, retry at HH:MM" readout would be much more actionable. Opening an issue for it right after this.
Planned follow-ups off the back of your feedback:
(a) query + render the rateLimit block GitHub exposes in the GraphQL response, so the footer can show remaining budget in real time;
(b) classify refresh errors so rate-limit / auth / network each get a specific recovery hint.
Probably v0.7.x once the tabbed-layout work on main settles.
Thanks again 🙏 — this is exactly the kind of feedback that keeps the roadmap honest.