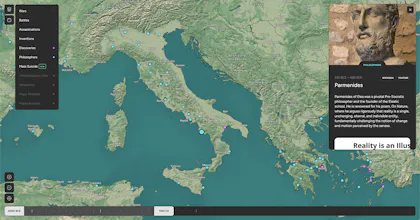
Explore battles, philosophers, inventions and more on an interactive 3D map. Filter by era and category to see how history unfolds across the globe. Powered by a custom AI data factory. **Desktop only for now**
Hey Product Hunt! 👋
I’m Yam, the maker of Globe of History.
**Desktop only for now**
This project started from a personal frustration. I was planning a trip to Greece and looking at Google Maps. All I could see were restaurants, hotels, and supermarkets. I kept thinking, "Socrates and Plato were right here. Great battles happened on this ground. Where are those pins?"
I wanted to see the history of the place, not just the commerce.
🌐 What it is: An interactive 3D globe that visualizes 6,000+ years of history. You can drag the timeline, or filter by categories like:
⚔️ Battles & Wars
🧠 Philosophers
💡 Inventions & Discoveries
💀 Assassinations
⚙️ How it works (The Tech): The biggest challenge wasn't the map; it was the data. There is no clean "history.csv" file. I built a 3-step AI Data Factory:
Collector: Scripts that crawl Wikipedia/Wikidata to find and verify real events (so the AI doesn't hallucinate).
Generator: Gemini AI writes engaging, narrative content for each event.
Verifier: A second AI agent fact-checks the content against source documents.
It’s still in beta, and the data is a constant work-in-progress.
I’d love your feedback:
There is about 15,000 events, How is the performance on your device?
Thanks for exploring! 🌍
@busmark_w_nika Right now, I don't have a direct 'add event' feature because I'm strict about verifying data sources to prevent misinformation. However, a 'Suggest an Event' button is definitely on the roadmap for future updates!
@yamsasson Fair enough, still think it is one of the most useful launches today :)
Report
Interesting idea @yamsasson . I’m curious how smooth the globe feels when loading large clusters of events at once. Does it stay responsive as you scroll through long timelines?
@harshmanwani Thank you! 🙌 I’m definitely planning to scale up the data factory. Regarding UX- I’d love to hear your thoughts. Was there a specific interaction or view you felt was missing? I’m currently experimenting with different ways to handle 'dense' timelines.
Give it a try! It handles the load surprisingly well. Even if you select the full range (-4000 to 2025) with all categories active-which is roughly 15,000+ events—it stays responsive. it’s obviously not 100% flawless and depends heavily on your internet connection
Report
Performance is good. Even with all events added it was fine to use, just a little laggy when moving the globe due to events populating but after initial load it ran relatively smoothly again. Really cool to see all these events where they actually occured.
I can really appreciate this project! Interested to see where it goes as far as collecting data, ensuring it's all accurate, etc. as the other commenters mention.
Globe of History
MultiDrive
@yamsasson Thank you. I really like it, especially that you take the facts!
minimalist phone: reduce your screentime
Man, this is brilliant idea – students should use it in the lessons of history. Is there a possibility to add some historical events by users?
Globe of History
@busmark_w_nika
Right now, I don't have a direct 'add event' feature because I'm strict about verifying data sources to prevent misinformation. However, a 'Suggest an Event' button is definitely on the roadmap for future updates!
minimalist phone: reduce your screentime
@yamsasson Fair enough, still think it is one of the most useful launches today :)
Interesting idea @yamsasson . I’m curious how smooth the globe feels when loading large clusters of events at once. Does it stay responsive as you scroll through long timelines?
Remix Mart
This is a great tool! I hope you continue to gather more data points and explore additional UX options.
Globe of History
@harshmanwani
Thank you! 🙌 I’m definitely planning to scale up the data factory.
Regarding UX- I’d love to hear your thoughts. Was there a specific interaction or view you felt was missing? I’m currently experimenting with different ways to handle 'dense' timelines.
Globe of History
Give it a try! It handles the load surprisingly well. Even if you select the full range (-4000 to 2025) with all categories active-which is roughly 15,000+ events—it stays responsive. it’s obviously not 100% flawless and depends heavily on your internet connection
Performance is good. Even with all events added it was fine to use, just a little laggy when moving the globe due to events populating but after initial load it ran relatively smoothly again. Really cool to see all these events where they actually occured.
Globe of History
@corey_paskewitz1 Thanks for the feedback...good to hear that
I can really appreciate this project! Interested to see where it goes as far as collecting data, ensuring it's all accurate, etc. as the other commenters mention.