Globe of History

Globe of History

Interactive 3D globe visualizing 6,000 years of history.

193 followers

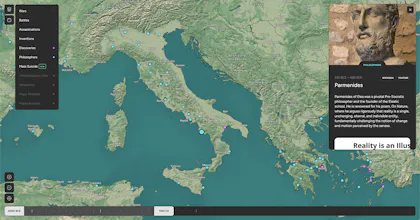
Explore battles, philosophers, inventions and more on an interactive 3D map. Filter by era and category to see how history unfolds across the globe. Powered by a custom AI data factory. **Desktop only for now**
Globe of History gallery image
Free
Launch Team / Built With
AssemblyAI
AssemblyAI
Build voice AI apps with a single API
Promoted

What do you think? …

Yam Sasson
Hey Product Hunt! 👋 I’m Yam, the maker of Globe of History. **Desktop only for now** This project started from a personal frustration. I was planning a trip to Greece and looking at Google Maps. All I could see were restaurants, hotels, and supermarkets. I kept thinking, "Socrates and Plato were right here. Great battles happened on this ground. Where are those pins?" I wanted to see the history of the place, not just the commerce. 🌐 What it is: An interactive 3D globe that visualizes 6,000+ years of history. You can drag the timeline, or filter by categories like: ⚔️ Battles & Wars 🧠 Philosophers 💡 Inventions & Discoveries 💀 Assassinations ⚙️ How it works (The Tech): The biggest challenge wasn't the map; it was the data. There is no clean "history.csv" file. I built a 3-step AI Data Factory: Collector: Scripts that crawl Wikipedia/Wikidata to find and verify real events (so the AI doesn't hallucinate). Generator: Gemini AI writes engaging, narrative content for each event. Verifier: A second AI agent fact-checks the content against source documents. It’s still in beta, and the data is a constant work-in-progress. I’d love your feedback: There is about 15,000 events, How is the performance on your device? Thanks for exploring! 🌍
Tetiana

@yamsasson Thank you. I really like it, especially that you take the facts!

Nika

Man, this is brilliant idea – students should use it in the lessons of history. Is there a possibility to add some historical events by users?

Yam Sasson

@busmark_w_nika 
Right now, I don't have a direct 'add event' feature because I'm strict about verifying data sources to prevent misinformation. However, a 'Suggest an Event' button is definitely on the roadmap for future updates!

Nika

@yamsasson Fair enough, still think it is one of the most useful launches today :)

Congratulations on the launch, Yam!

When the AI collects and verifies historical information, how do you make sure the details are not influenced by biased or incomplete sources on Wikipedia or Wikidata? Do you have any manual review or quality control in place or is the verification fully automated right now?

Yam Sasson

@muhammad_tahir29 
To prevent hallucinations, I strictly use Wikipedia/Wikidata as a structural 'skeleton'—only pulling objective metadata like titles, years, and URLs. This anchors the AI to a source of truth rather than relying on generative text.

For dense categories, I filter by translation count to surface globally significant events. On top of that, I personally spot-check the data manually after every batch.

That said, bias is tricky. This map ultimately reflects who documented their history well, rather than just 'what happened.' Regions with strong written traditions appear denser because their records were preserved and translated. It's a visualization of recorded history, with all the inherent survivorship bias that comes with it.

Chilarai M

Awesome idea. Where do you fetch the new data from? Can we upload our own?

Yam Sasson

@chilarai Source: Real-time metadata from Wikipedia & Wikidata. Uploads: Not yet! To keep the quality high and prevent misinformation, I’m currently only pulling from verified Wiki pages. But a 'Community Suggestions' feature is definitely on the roadmap.

Chilarai M
Anushka Hode

Congrats on the launch! This is such a refreshing idea, it actually makes history feel alive instead of just something we read in textbooks. The 3D map + timeline combo is super immersive.

One thing I’m curious about: with so many events loaded in, which category did people explore the most during your beta battles, philosophers, or inventions?

Yam Sasson

@anushkahode 
To be honest, I’m using very privacy-friendly (and basic) analytics right now, so I don't track individual clicks on categories yet. But based on the screenshots and messages users are sending me, Battles seems to be the clear favorite.

Anushka Hode

@yamsasson Got it! Battles being the favourite makes sense, they’re usually the first thing people explore.

Harsh Manwani

This is a great tool! I hope you continue to gather more data points and explore additional UX options.

Yam Sasson

@harshmanwani 
Thank you! 🙌 I’m definitely planning to scale up the data factory.
Regarding UX- I’d love to hear your thoughts. Was there a specific interaction or view you felt was missing? I’m currently experimenting with different ways to handle 'dense' timelines.

Zeng

Love this tool! I showed my kids and they love it.

Yam Sasson

@zeng That is the best feedback I could ask for!

12
Next
Last