If you re a designer, PM, or growth person, you probably know the drill: You spot a competitor flow you want to study, then you start screenshotting, naming files, pasting everything into Miro/Notion/Figma, trying to recreate the real navigation, and adding notes that end up scattered everywhere.
It works, but it s slow, messy, and hard to share.
I lately as building a GitHub project(https://github.com/MathObsession...) with the goal to make a highly effecient and small voice assistant, I hope this is helpful.
Funchart is a very simple web app that: Let's you upload a CSV or Excel file. Uses AI to generate the most suitable chart for your data automatically. I d love your feedback Since this is just the beginning, it s completely free to use. I m posting here because I truly want to know: to generate the most suitable chart for your data automatically
Do you think this solves a problem for you? Is the one-click experience actually working? What s the ONE thing you d want me to add next?
We ve just launched Aepto! It helps you manage domains, SSLs, website monitoring, and performance insights in one place. Custom reminders, smart notifications, and centralized views make running multiple sites easier and less stressful.
Most features are available for free, so anyone can get started right away.
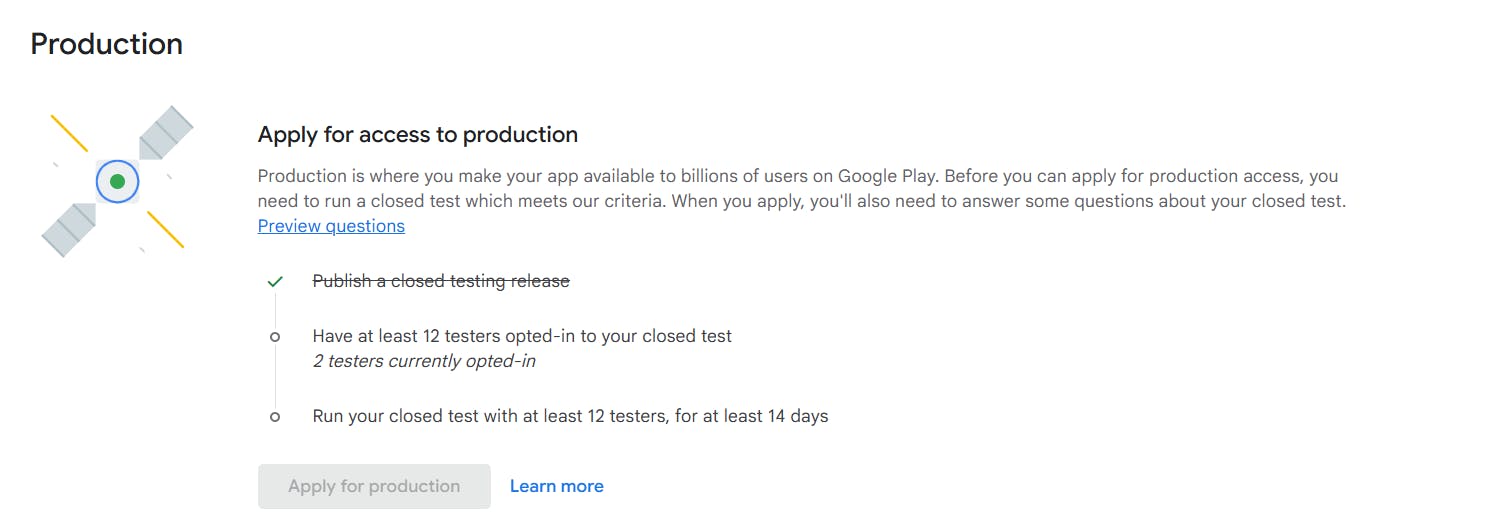
Hi guys. I am seeking testers to help me test the application for Google Play Store production approval + General improvements feedback. I have created an app called "Easy Glow", EasyGlow is your personal skincare companion. Get AI-powered skin analysis, personalized routines, track your progress, and achieve your skincare goals. Features include daily skin scans, custom morning & evening routines, progress tracking, smart reminders, and expert tips. If you have an app currently in closed testing, I can assist testing your app as well.
EasyGlow - Apps on Google Play Please share your email with me if interested via this form and I will add it on Google Play console to access the app: https://forms.gle/vopQEK632J1GuWWk7 Thank you and stay blessed.
I built SubTrackHub, a developer-first engine that connects your AWS accounts, GCP projects, and GitHub organizations to find the cost leaks that standard billing consoles miss.
The problem: For most teams, cloud spend is fragmented. You have AWS instances in one tab, GitHub seats in another, and a dozen SaaS tools on different credit cards. Because the data is scattered, you miss the "sneaky" costs like idle NAT Gateways, forgotten test instances, or zombie GitHub seats for employees who left months ago.
SubTrackHub fixes that. Instead of just showing you a graph of your bill, it deep-scans your infrastructure to pinpoint exactly where the waste is. It moves beyond basic billing APIs to ingest the AWS CUR (Cost and Usage Report), giving you sub-penny accuracy on exactly what s happening in your VPCs.
Most fitness apps have quietly become engagement products. You open them to log a set of squats and end up tapping through five screens, past a social feed, past upsells just to enter a number. That's not a tool. That's a slot machine.