Launched this week

Nodey
Your n8n command center, now on your phone
218 followers
Your n8n command center, now on your phone
218 followers
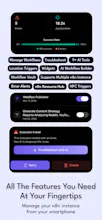
Nodey is a mobile companion for n8n. Monitor your workflows in real time, diagnose failed executions with AI, build workflows from a prompt, and trigger automations with NFC tags or geofenced locations — all from your phone.


Free Options
Launch Team / Built With


Nodey
@thefamoushesham congrats on the launch Hesham. Quick diagnose and resolve sounds like a winner.
Nodey
@zolani_matebese Thank you — really appreciate it!
The on-call angle is the real pitch here. I run WhatsApp bots for small businesses and failures never happen when I'm at the desk - it's always a webhook dying on a Saturday. Checking the failed execution from the phone instead of opening the laptop is exactly the gap. Question: when the AI diagnoses a failed execution, does it point to the specific node and param, or is it more a plain-language summary?
Nodey
@david_marko Yes, I think part of the reason why I developed this app is because of the back pain I was getting sitting so long in front of my computer. To answer your question... in the tests I've done, yes, it will point to the failure node but the response is usually provided in the format of long form text, which I now realise might not be the most convenient when people really want a quick look at their phones.
I've made a note of that for the next update... should be an easy JSON schema fix.
Thank you so much!
Mailwarm
Does it show the exact run logs and suggest a fix, or does it just summarize what went wrong?
Nodey
@thamibenjelloun It actually does. It will absolutely suggest a fix and will provide JSON that you can export with the tap of a button to your n8n instance. It will also pinpoint the failure node but the response is usually provided in the format of long form text, which I now realise might not be the most convenient when people really want a quick look at their phones. I've made a note of that for the next update... should be an easy JSON schema fix.
Thank you so much!
Mobile access to n8n workflows is a gap that's been surprisingly underserved. n8n's web UI is powerful but it's not really built for mobile triage. The interesting challenge is maintaining a coherent state view when workflows can be mid-execution. How do you handle real-time execution monitoring on mobile? WebSockets to the n8n instance directly, or does Nodey proxy the state updates?
Nodey
@anand_thakkar1 Neither, actually — Nodey talks straight to your instance with no middleman, but over REST polling rather than WebSockets. As far as everything that we've tried indicates, n8n's push channel (/rest/push) is internal-only — cookie-authenticated for the editor UI and unstable across versions — so the public API (/api/v1) effectively mandates polling for third-party clients. While an execution is live, Nodey polls it on a tight interval (5s default, remotely tunable so I can throttle fleet-wide if needed), then drops to iOS background refresh plus refetch-on-foreground otherwise — the instance stays the single source of truth, so the app never trusts a stale local view. And deliberately no proxy: your API key and execution payloads never touch any server of mine.
DIY UX Test
Running n8n means workflows break at the worst times, away from a laptop. A command center on my phone to catch a failed execution and re-run it is the obvious missing piece. Can Nodey edit a node mid-flow, or is it monitoring + triggering for now?
Nodey
@oleksii_sekundant The catch-and-re-run loop is exactly what's built: background polling flags the failed run, you get a notification, open the execution to see which node errored with its output, and retry (or stop/delete) it right there — plus toggle workflows and fire webhook triggers manually, via NFC tag, or by geofence. Node-level editing isn't in yet, and that's somewhat deliberate: the public n8n API has no granular node PATCH (you'd replace the whole workflow JSON), and an in-flight execution runs the version it loaded at start anyway — so "mid-flow edits" can't rescue a running execution even in theory. Where Nodey goes past pure monitoring is creation: the AI builder drafts complete workflows from a prompt and pushes them to your instance, and a debug companion reasons through why a node failed. Editing the canvas is the one thing n8n's web UI proves doesn't shrink to a phone — if I add it, it'll be parameter tweaks on a single node, not graph surgery.
@thefamoushesham n8n users are usually pretty technical and already have dashboards, alerts, and monitoring in place. What made early users install Nodey instead of just relying on the tools they already had?
There must have been a specific pain point that kept coming up?
Nodey
@josh_bennett1 Honestly, the first early user was me — I run n8n myself after all. It's a useful tool if you don't want to be stuck at your computer all day monitoring workflows and it combines enough elements (I think) to actually allow you to manage your workflows without having to reach out to your computer all the time. The other key feature is the location trigger, which I've been personally used to trigger workflows when I arrive or leave a place.
I also don't think there is an app that currently lets you build workflows with AI and export them directly to your n8n instance as well as store your workflows so you can restore them to another n8n instance and produces reliable homescreen widgets that lets you see if any execution errors popped up recently.
@thefamoushesham One thing I keep thinking about:
n8n workflows often connect multiple external services, APIs, databases, and AI models.
When something breaks, the root cause is usually somewhere outside n8n itself.
How do you approach troubleshooting in those situations? Can Nodey help narrow down where the failure originated, or is it primarily focused on the execution data coming from n8n?
Nodey
@moh_codokiai Nodey's raw material is the n8n execution record — but that's richer than it sounds, because when an external service fails, its failure signature is captured in the failing node's error output: the 401 from an expired key, the 429 from a rate limit, the timeout from a slow database. So the execution detail view answers the first triage question at a glance — which node died and what the service said — by showing the full node chain with per-node status, timing, and error message. From there, failed executions get a one-tap AI diagnosis, and the Debug Companion chat can take the workflow's JSON and reason about whether the cause is your expression, your credentials, or their outage — and what to check next.
What it won't do... is probe your Postgres or your Stripe account directly: the goal is getting from "something broke" to "it's the Stripe node, 401, rotate the key" in a minute from your phone.