
Databox is an AI-powered business intelligence and analytics platform for teams that need clear, trusted answers fast. It offers the best of BI, without the complicated setup, steep price, or long learning curve. It provides a blend of powerful, but easy-to-use, features, from preparing datasets and creating the custom metrics your company needs to track, to building beautiful dashboards, customizing your reporting, and receiving AI-powered insights.
This is the 8th launch from Databox. View more

Artifacts by Databox
Launched this week
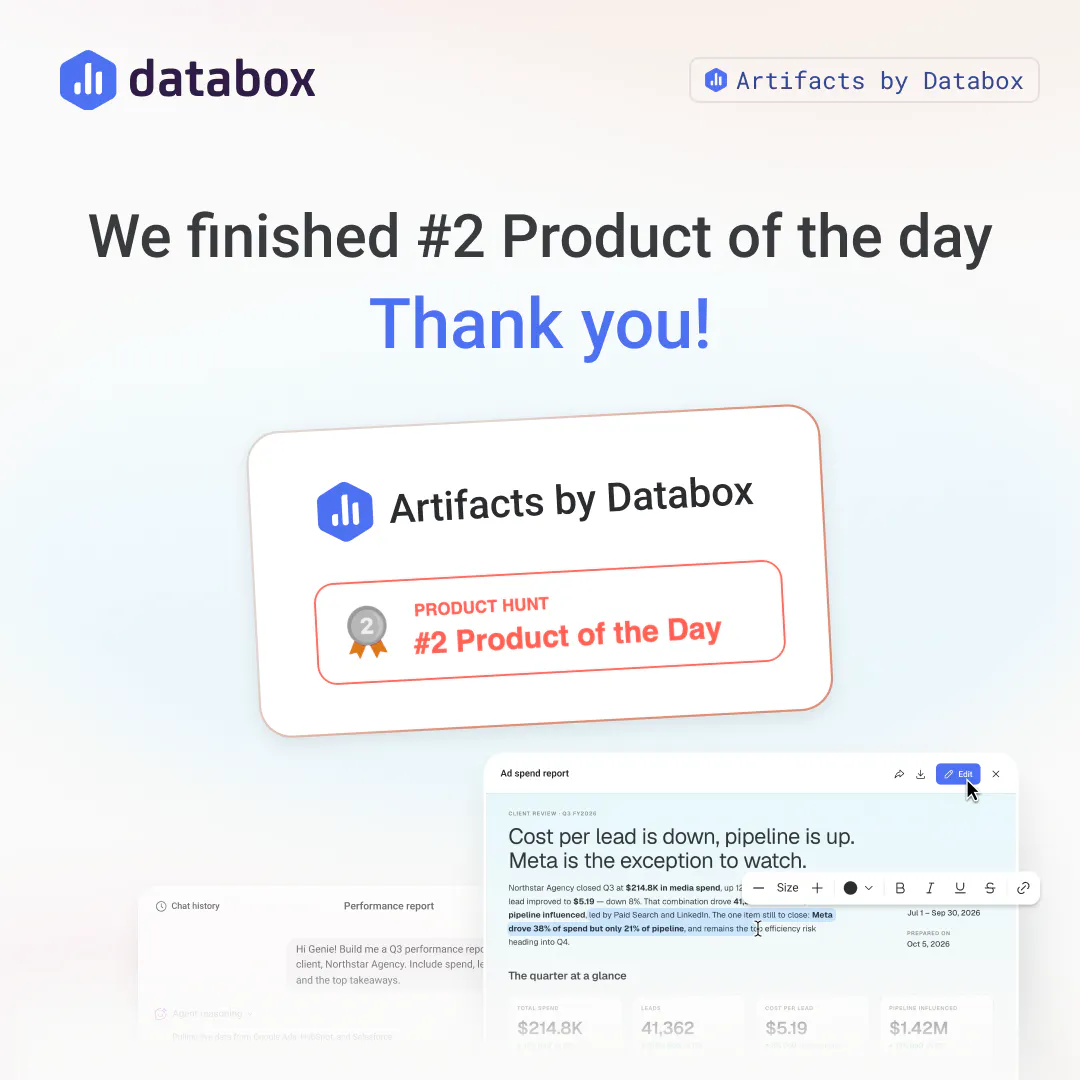
Turn any conversation with your AI Analyst into a polished report, slide deck, or interactive document built from your live data. Generate it from a single prompt, then share it via public link or download as a PDF.


Free Options
Launch Team / Built With



Databox
@dhirajwohra Thanks Dhiraj. That part's really down to what you ask Genie for rather than a separate toggle, since Genie is doing the analysis before it builds the artifact. So asking something like "flag any outliers in this month's data" as part of the prompt should get you that layer of analysis baked into the report, not just the raw numbers charted out.
Being able to ask for the same analysis restyled for a different client's branding without rebuilding it is the part I would use most. Pulling from live data at generation time also avoids the usual stale screenshot problem. When a report goes out as a public link, does it refresh against live data on every view or is it frozen at the moment you generated it?
Databox
@adamkamaneh Good question, and the honest answer: it's frozen at the moment you generate it. A public link shows a snapshot, so it won't refresh on its own if someone views it later or the underlying numbers change. If you want fresh numbers, you'd re-trigger the report and share the new link. Live-refreshing links are on our roadmap, just not there yet.
This looks useful for teams that need to share reports quickly. Can you also trace each number back to the original data and filters when someone asks about it?
Databox
@liana_preston Good question, and I want to be careful not to overstate this one. Genie pulls real numbers from your connected sources into the artifact, so what you see matches your dashboards, but there isn't a built-in "trace this number back to the filters/query" feature inside the artifact itself today. If you need to verify a specific figure, you'd go check the underlying metric or databoard directly. Let me know if that's the kind of drill-down you're picturing, that'd be useful feedback for the roadmap.
congrats on the launch! is there a limit to how large the data sets can be/upfront usage? for example if I'm migrating from another tool could I upload my larve pre-existing data sets?
Databox
@ethan_cheng Thanks Ethan. For data already connected to Databox, there's almost no dataset size limit that would block this, it pulls from your existing metrics. For migrating from another tool, we have an Ingestion API where you can push historical data in from other tools or even AI clients like Claude, though I don't have a specific size ceiling for that path in front of me. If you're planning a larger migration, happy to have someone follow up with specifics.
the edit-mode-vs-prompt-mode split is a smart way to avoid the "AI overwrote my wording" problem. question on that: once I've hand-edited a few sections and then ask Genie for a structural change later, is there version history I can roll back to if the new prompt mangles something near my edits, or is the artifact a single mutable document with no undo path back to an earlier state
Databox
@galdayan Good question, and I want to answer this carefully since it matters. Genie is made aware of your edits before it makes a structural change, so it builds on your version rather than blindly overwriting it. What I'm not certain about is whether there's a full version history/rollback you can access if something still gets mangled near your edit, versus the artifact being a single mutable document. Don't want to guess on that one, let me confirm and get back to you rather than answer wrong on something this specific.
Turning an analyst request into a shareable report could remove a lot of reporting friction. Can readers trace every conclusion back to the underlying metric, source system, and transformation used by the AI analyst?
Databox
@russlan_ramdowar Good question, and want to be precise here since it's an important distinction. Genie pulls real numbers from your connected sources into the report, so what you see matches your dashboards, not a hallucinated figure. That said, there isn't a built-in trace-back panel inside the artifact itself showing the exact transformation or source system per number today, you'd check that in the underlying metric or databoard directly. Good feedback for the roadmap though, appreciate you raising it.
How customizable are the reports? Can teams define their own metrics and reporting structure?
Databox
@reda_roqai_chaoui Pretty customizable on the structure and styling side, you can ask Genie for a specific layout, sections, and restyle colors, fonts, and charts to match your needs. On metrics, Genie pulls from whatever data sources you've connected to Databox (130+ integrations), so it's working from your existing metrics rather than a fixed template. If you mean defining brand-new custom calculations from scratch, that's more a Databox metric-building question than an Artifacts one, happy to point you to the right resource if that's what you're after.