

octoscope 0.25.0 is out: a red CI dot now tells you what broke. 🔴

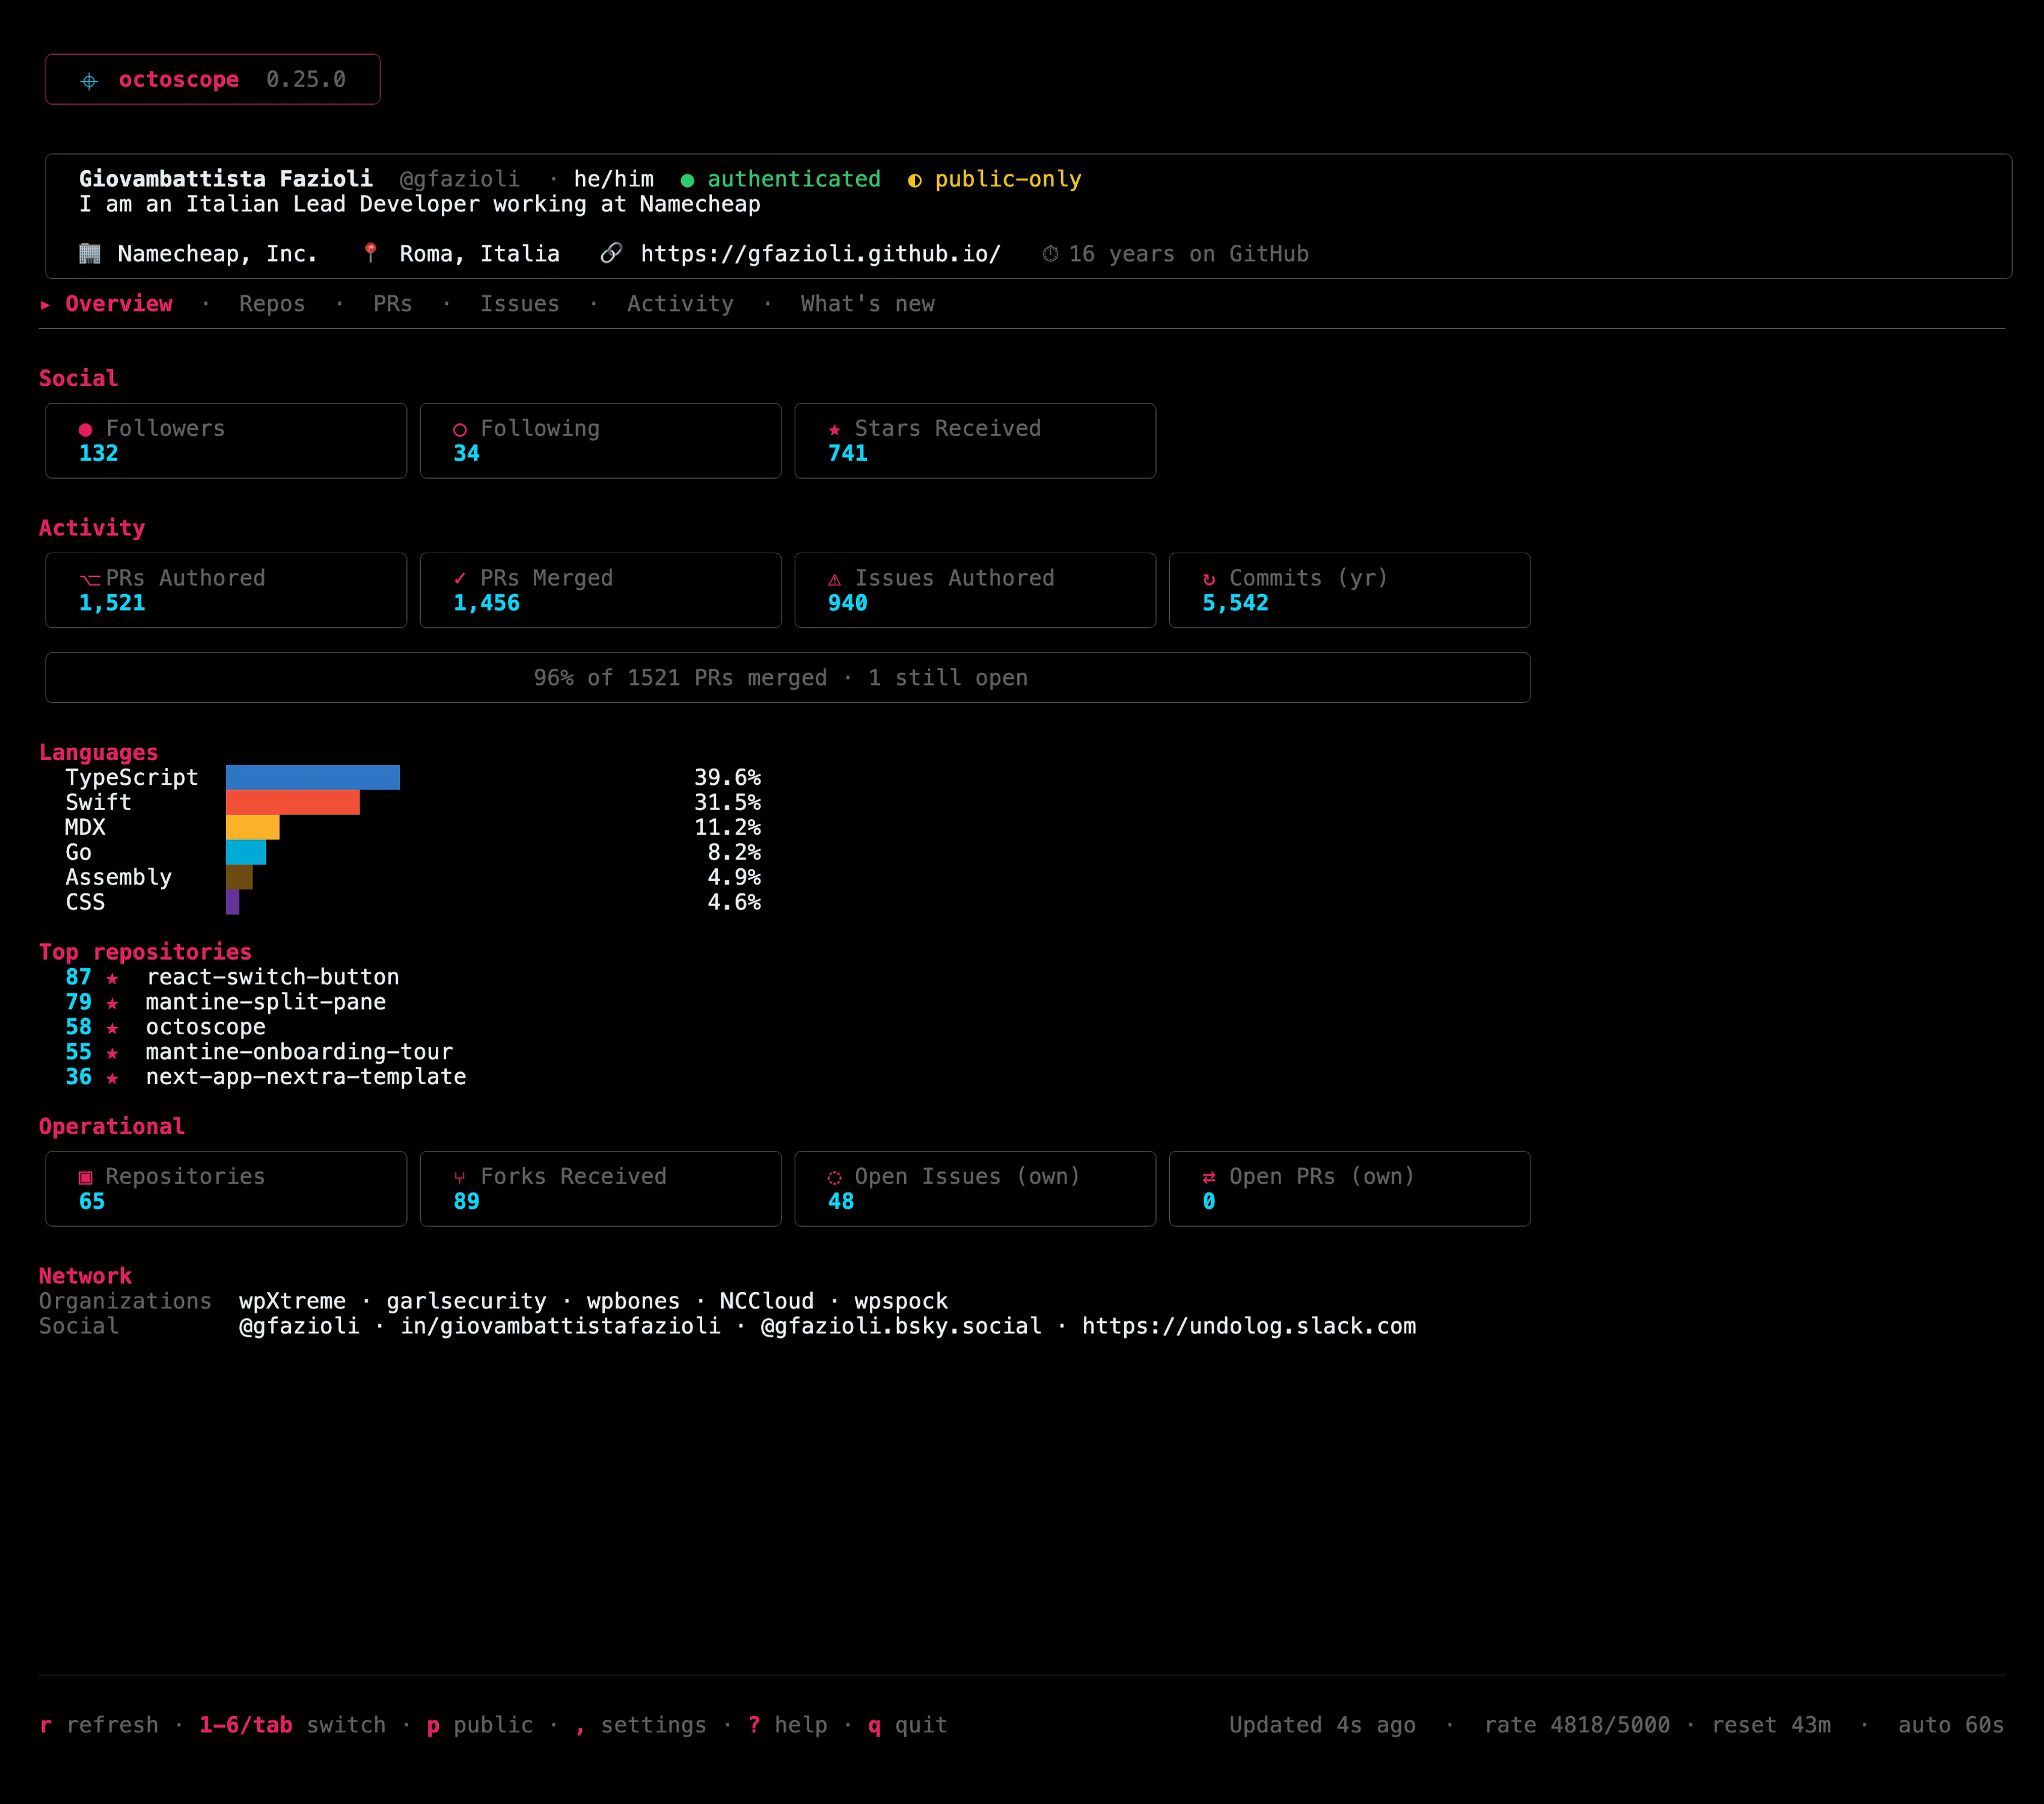
The Repos tab has shown a CI rollup dot per repository for a while, and it always stopped there. Red meant something was wrong, and then you went to the browser to find out what. That last step was the annoying one.
Now you open the repo and the drill-in answers it: a Checks section listing the individual checks on the default branch, with failures floated to the top. That ordering matters more than it sounds — the list is capped at eight rows, so a red job in a forty-job matrix would otherwise hide behind all the passing ones.
Each check name is a terminal hyperlink straight to its run on GitHub. Click it if your terminal supports OSC 8; it stays plain text if it doesn't. 🔗
Tip: it works in the PR drill-in too, since both views share the same renderer now.
Another tip — the section reads just as well on the monochrome, phosphor and amber themes, because outcomes are distinguished by glyph (✓ ✗ · ⏳) rather than by colour.
One detail I enjoyed getting right: only https targets on GitHub's own domain become clickable. When a third-party CI provider reports through the Checks API, its link points at its own dashboard — and a GitHub-looking row shouldn't be a one-click trip somewhere else. URLs carrying bytes that could break out of the terminal escape sequence are refused outright.
brew upgrade gfazioli/tap/octoscopeHow do you check CI today — browser tab, gh CLI, or something else? I'm curious whether the terminal is where you'd want this at all, and what you'd reach for next.
https://gfazioli.github.io/octoscope
Replies