

How do you turn raw data into visual reports?
by•

Hey PH community!
Most teams we talk to spend hours taking a clean CSV/Excel sheet and manually building slides or reports for stakeholders, clients, or newsletter readers.
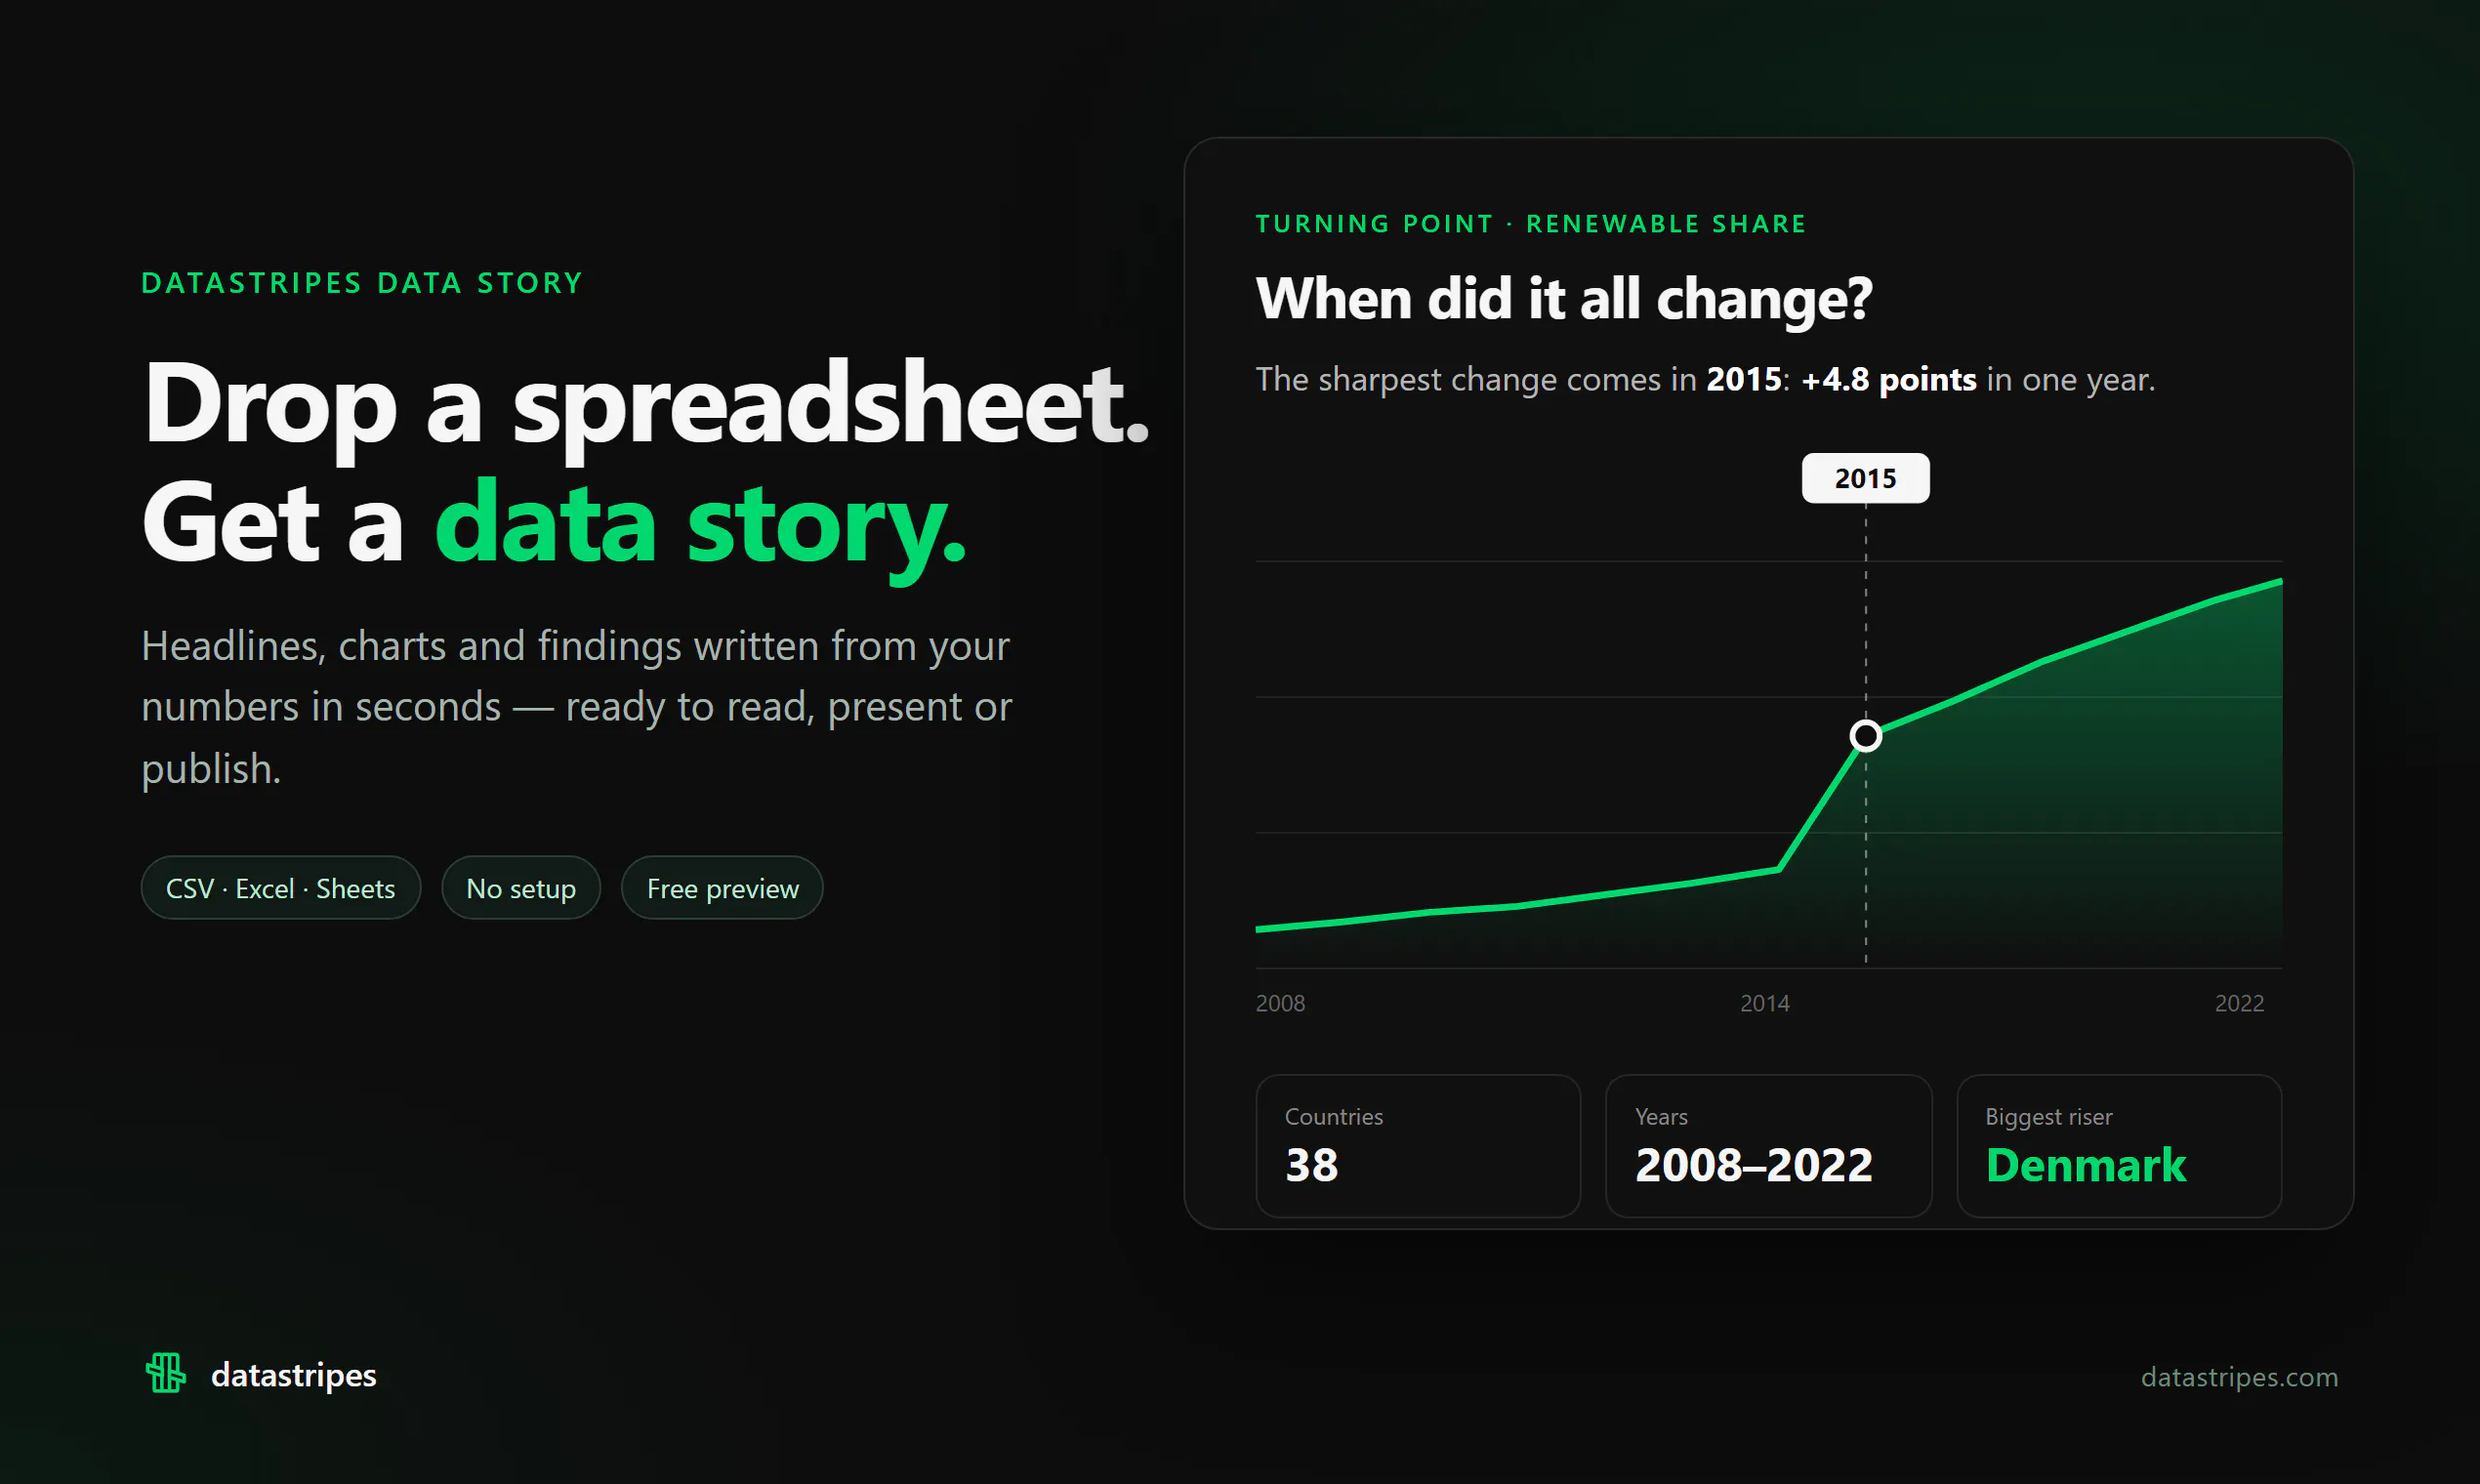
We just launched Datastripes Data Stories to completely automate this process. It takes any spreadsheet, automatically pulls the main metrics/trends, and outputs a visual story (slides, bento layout, articles) in plain English.
How are you currently turning numbers into insights for your audience? Would love to hear your workflow or roasts on our approach!
Today is the launch day: https://www.producthunt.com/products/datastripes?launch=datastripes-data-stories
13 views
Replies
Be the first to reply
Have a question or a thought to share? Add a comment above to start the conversation.