
Pandada AI
Build data wealth: Turns files into McKinsey-level insights
991 followers
Build data wealth: Turns files into McKinsey-level insights
991 followers
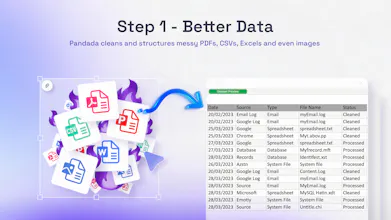
Pandada empowers both non-technical operators and data scientists to achieve data wealth. Move beyond "chatting" with data—Pandada turn messy csvs, pdfs, excels files, and even photos into downloadable and shareable McKinsey-level reports and presentations — so you can make better decisions grounded in data.




Free Options
Launch Team

Render Sandboxes: a computer for every agentRun untrusted code safely. Idle sandboxes cost nothing
Promoted
The micro tools on your site are part of an SEO strategy or they are included as part of the larger product? Congrats on the launch!!
@roopreddy Thanks! Good question. The shortcuts on our site are part of the broader Pandada product — they’re designed to handle small, high-frequency tasks quickly, and also serve as an easy entry point for new users.
They’re useful on their own, but they connect naturally into the larger workflow when you need deeper analysis.
@roopreddy Thanks for your support!
Congrats on launching today. How does this differ from other AI data analyst agents?
@zerotox Good question!
Chat-based AI tools are great at conversation.
Pandada is built for analysis delivery.
Workflow-first, not chat-first
Built-in analytical structure, not blank prompts
Outputs designed for decisions, not just reading
Pandada works less like a chatbot, and more like a junior analyst who already understands the task.
Pandada seems especially useful for comparisons. How smart is the column mapping? If one file has "Revenue" and another has "Total Sales", will it figure out they are the same field?
@chouti Spot on, Daniel! That’s exactly what we aimed for. It’s smart enough to know that different names can mean the same thing (like your Revenue vs. Total Sales example), which saves a ton of manual cleanup. Try throwing your messiest files at it—I think you’ll be pleasantly surprised :)
@chouti thanks for your support~
@chouti Thank you so much for the support!
@chouti Thanks! Yes — it automatically maps equivalent columns like those.
Congrats! If you’ve ever struggled with VLOOKUPs, Pandada feels like a superpower. It makes data matching and alignment simple without manual formulas.
@michelle_thirteen Thanks! We’ve definitely felt that VLOOKUP pain ourselves 😄
Glad Pandada could make matching and alignment feel effortless without manual formulas.
Great work team. For non-technical users, how much guidance does the prompt give? Do I need to know the right statistical terms to get a good result, or can I just ask in plain English?
@emily007 Hey Emily! Honestly, don't worry about the jargon at all.
You can talk to Pandada just like you’re chatting with a friend. Plain English is all you need. Since it’s a web app, we’ve built a library of real-world use cases and templates right into the site to help you get moving immediately.
It’s basically like having a "cheat sheet" to start getting insights without any setup. I'd love for you to give it a spin and let me know if it feels intuitive enough! 🐼✨
@emily007 Thanks so much for your supporting
@emily007 Thanks! Plain English is totally fine.
@emily007 Thank you for your support!
Fast enough to use during live meetings. Instead of saying "I'll check and get back to you", I uploaded the Q3 report to Pandada and had the answer before the meeting ended. Great for on-the-spot decision making.
@zephyrlink_i Thank you for your support!
@zephyrlink_i Thanks for supporting our product~ and that really cheer me up~
@zephyrlink_i Thanks! Love that use case — exactly what we built it for
@zephyrlink_i Glad we could help you nail the Q3 report on the fly. Honestly, sending that "let me check and get back to you" email is the absolute worst. We basically built this so you can wrap up the work before the meeting is even over and actually go enjoy your lunch while everyone else is still stuck in spreadsheet hell.
@zephyrlink_i That’s a perfect example of what Pandada is built for — answers while the conversation is still happening. Thanks for sharing this!
What formats are these reports and presentations in?
@syed_shayanur_rahman Good question. Pandada-generated reports can be exported as Markdown or PDF, and charts as PNG, JPG, or SVG, depending on how you want to use them.
@syed_shayanur_rahman Pandada generates Word and Excel files directly, or you can export your reports as Markdown and PDF. We're also finishing up HTML and direct PPT support for the next release. Let me know if that works for your workflow!