
NetworkSpy
HTTP(s) proxy debugger with custom viewer
97 followers
HTTP(s) proxy debugger with custom viewer
97 followers
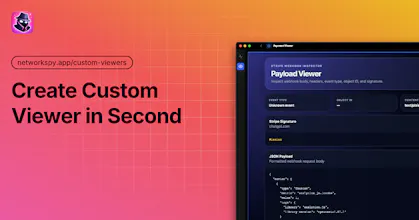
Inspect, debug, and understand modern API traffic with NetworkSpy — a network debugger built for GraphQL, streaming, and AI apps. When joining new projects, learning other teams’ systems, or tracking tricky issues, a custom viewer makes everything easier. Instead of raw payloads, focus on real problems with your team. Don’t fall behind in the AI era. Build faster, debug smarter, and ship better products with the right tools.
Interactive



Free
Launch Team / Built With


Dropbox SignSimple, secure eSignatures for the way your team works.
Promoted


Can NetworkSpy capture and visualize the full agent loop, like prompts, responses, and function calls, in one timeline?
Hi @thamibenjelloun, thanks for the question!
NetworkSpy's built-in LLM viewers are designed for OpenAI-compatible /completions and /chat/completions endpoints. They provide a structured, developer-friendly view of requests and responses, including messages, available tools, response choices, and streaming chunks. The goal is to make debugging intuitive and enjoyable, rather than forcing developers to sift through large volumes of raw JSON.
For full agent-loop visualization—such as prompts, responses, tool/function calls, and execution flow in a single timeline—the built-in viewers are not intended to serve as a backend observability solution.
That said, NetworkSpy's Custom Viewer Builder gives you the flexibility to create your own visualization layer. You can build viewers for individual traffic inspections or aggregate multiple traffic inspections into a single custom view. This allows you to parse traffic data and present it in whatever format best fits your workflow, including agent execution timelines and cross-request flows.
Custom viewers can also be versioned in GitHub and shared across your team, ensuring everyone has a consistent understanding of how data and requests move between clients, servers, and AI agents.