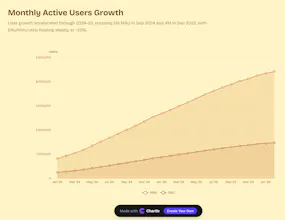
Type what you want, like "Tesla vs Apple stock 2025" and Chartle searches the web, finds real data, and builds your chart with cited sources. No spreadsheets, no data entry, no design skills. Upload a screenshot of any chart or table and convert it into a fully editable visualization. Paste CSV or raw data and we'll handle the rest. 8 professional themes, interactive embeds for Notion/blogs, high-res PNG/SVG export, and multi-chart dashboards. Free to try, no signup needed.
Hey PH! I'm Chris, solo dev behind Chartle.
I wanted to make creating charts as simple as describing them. No spreadsheets, no design tools, no hunting for data — just type what you want, or screenshot an existing chart, and get something clean and editable in seconds.
The bit I'm most proud of is the AI web search. Type "UK house prices over 20 years" and Chartle actually goes and finds the data, builds the chart, and cites where it came from. Got a chart trapped in a PDF or slide deck? Screenshot it and Chartle will recreate it as a proper interactive visualization.
Themes, high-res export, embeddable anywhere, and you can combine charts into dashboards.
Free to try, no signup needed. Just go to chartle.app and type a query. If you want to lock in early, there's a $99 lifetime deal for the launch, but the free tier gives you 5 charts/month to try it out first.
Would love your feedback. What chart would you try first?
Erda