Free, open-source dashboard that shows which AI tools run on your computer, what they connect to, what they can access and how many tokens they use. Local and read-only: no cloud, no account. macOS, Linux, Windows (beta).
Hi Product Hunt 👋 I'm Safa, the maker of SecAIQ Watch.
AI assistants now read our project files, run commands and connect to MCP servers, yet most of us can't say what they are connected to or allowed to touch. I built SecAIQ Watch to make that visible on my own machine.
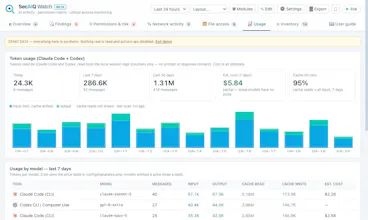
What it does: • Detects ~37 AI tools and ~33 providers (coding agents, chat apps, AI editors, local models, MCP servers) • Shows live connections and bytes sent/received per tool • Maps each tool to sensitive areas: SSH keys, .env files, cloud credentials, browser data, keychain • Flags risky settings and gives a posture grade from A to F • Tracks token usage for Claude Code and Codex • Exports reports and an AI-BOM (CycloneDX 1.5)
How it stays safe: it is local and read-only, it never sees prompts or file contents, the panel only answers on 127.0.0.1, and it loads no third-party code.
It's a beta and I want to be upfront about that. It works well on macOS. Linux and Windows have only been tested against sample command output so far, and Windows can't report per-connection byte counts at all. That is exactly where your feedback helps most: run `php bin/diagnostics.php` and open a GitHub issue if something looks off.
It is MIT-licensed and needs only PHP 8.1+ with SQLite (no Composer, no database server, no account). There is a built-in demo mode with synthetic data if you'd rather explore before pointing it at your own machine.
What would you want it to show that it doesn't yet?
Report
Does it show a breakdown per tool or just an overall view of network activity?
@khaildnaseem It's per tool. Every connection is attributed to the tool (or one of its child processes) that opened it, so you get sent/received bytes, destinations and providers for each tool separately, plus an overall traffic chart split by tool. Click a tool for its own processes, connections and permissions.
You can see it in the live demo (synthetic data, no install): https://spaksu.github.io/secaiq-watch/demo/ (Network activity tab). One caveat: byte counts per connection work on macOS and Linux; Windows shows connections and destinations but has no per-connection byte counters.
the part I'd want answered before trusting the posture grade: this detects ~37 tools by some kind of signature. what happens when a tool isn't in that list - does it just not show up, or does it flag "unknown process with network access" as its own category? a detector that goes quiet on unrecognized tools is more dangerous than no detector at all, because it replaces "I don't know what's happening" with a false "everything's fine" from a dashboard that looks authoritativ
@galdayan Fair challenge, and you were right: until now, a process that wasn't in the signature list only showed up if it talked to a known AI provider address; anything else was silently ignored, and the grade said nothing about coverage.
I've just changed both. There's now a "Not classified" view listing every other process with outbound connections (process, destinations, bytes), and the posture grade carries a coverage line, e.g. "based on 6 recognised tools; 14 unclassified processes are using the network". The grade is still a score for the tools it recognises, and it now says so. New signatures are one regex in config/signatures.php.




SecAIQ Watch
Hi Product Hunt 👋 I'm Safa, the maker of SecAIQ Watch.
AI assistants now read our project files, run commands and connect to MCP servers, yet most of us can't say what they are connected to or allowed to touch. I built SecAIQ Watch to make that visible on my own machine.
What it does:
• Detects ~37 AI tools and ~33 providers (coding agents, chat apps, AI editors, local models, MCP servers)
• Shows live connections and bytes sent/received per tool
• Maps each tool to sensitive areas: SSH keys, .env files, cloud credentials, browser data, keychain
• Flags risky settings and gives a posture grade from A to F
• Tracks token usage for Claude Code and Codex
• Exports reports and an AI-BOM (CycloneDX 1.5)
How it stays safe: it is local and read-only, it never sees prompts or file contents, the panel only answers on 127.0.0.1, and it loads no third-party code.
It's a beta and I want to be upfront about that. It works well on macOS. Linux and Windows have only been tested against sample command output so far, and Windows can't report per-connection byte counts at all. That is exactly where your feedback helps most: run `php bin/diagnostics.php` and open a GitHub issue if something looks off.
It is MIT-licensed and needs only PHP 8.1+ with SQLite (no Composer, no database server, no account). There is a built-in demo mode with synthetic data if you'd rather explore before pointing it at your own machine.
What would you want it to show that it doesn't yet?
Does it show a breakdown per tool or just an overall view of network activity?
SecAIQ Watch
@khaildnaseem It's per tool. Every connection is attributed to the tool (or one of its child processes) that opened it, so you get sent/received bytes, destinations and providers for each tool separately, plus an overall traffic chart split by tool. Click a tool for its own processes, connections and permissions.
You can see it in the live demo (synthetic data, no install): https://spaksu.github.io/secaiq-watch/demo/ (Network activity tab). One caveat: byte counts per connection work on macOS and Linux; Windows shows connections and destinations but has no per-connection byte counters.
Dial
the part I'd want answered before trusting the posture grade: this detects ~37 tools by some kind of signature. what happens when a tool isn't in that list - does it just not show up, or does it flag "unknown process with network access" as its own category? a detector that goes quiet on unrecognized tools is more dangerous than no detector at all, because it replaces "I don't know what's happening" with a false "everything's fine" from a dashboard that looks authoritativ
SecAIQ Watch
@galdayan Fair challenge, and you were right: until now, a process that wasn't in the signature list only showed up if it talked to a known AI provider address; anything else was silently ignored, and the grade said nothing about coverage.
I've just changed both. There's now a "Not classified" view listing every other process with outbound connections (process, destinations, bytes), and the posture grade carries a coverage line, e.g. "based on 6 recognised tools; 14 unclassified processes are using the network". The grade is still a score for the tools it recognises, and it now says so. New signatures are one regex in config/signatures.php.
Release: https://github.com/Spaksu/secaiq-watch/releases/tag/v0.10.0-beta.
Demo: https://spaksu.github.io/secaiq-watch/demo/