

🦊 Netfox 0.7.0 — what's new

Hey everyone 👋
Just shipped Netfox 0.7.0. Here's what's new:
Netfox 0.7.0 goes deeper on ports — and gives Settings a fresh, scannable look.
🔍 Full Scan
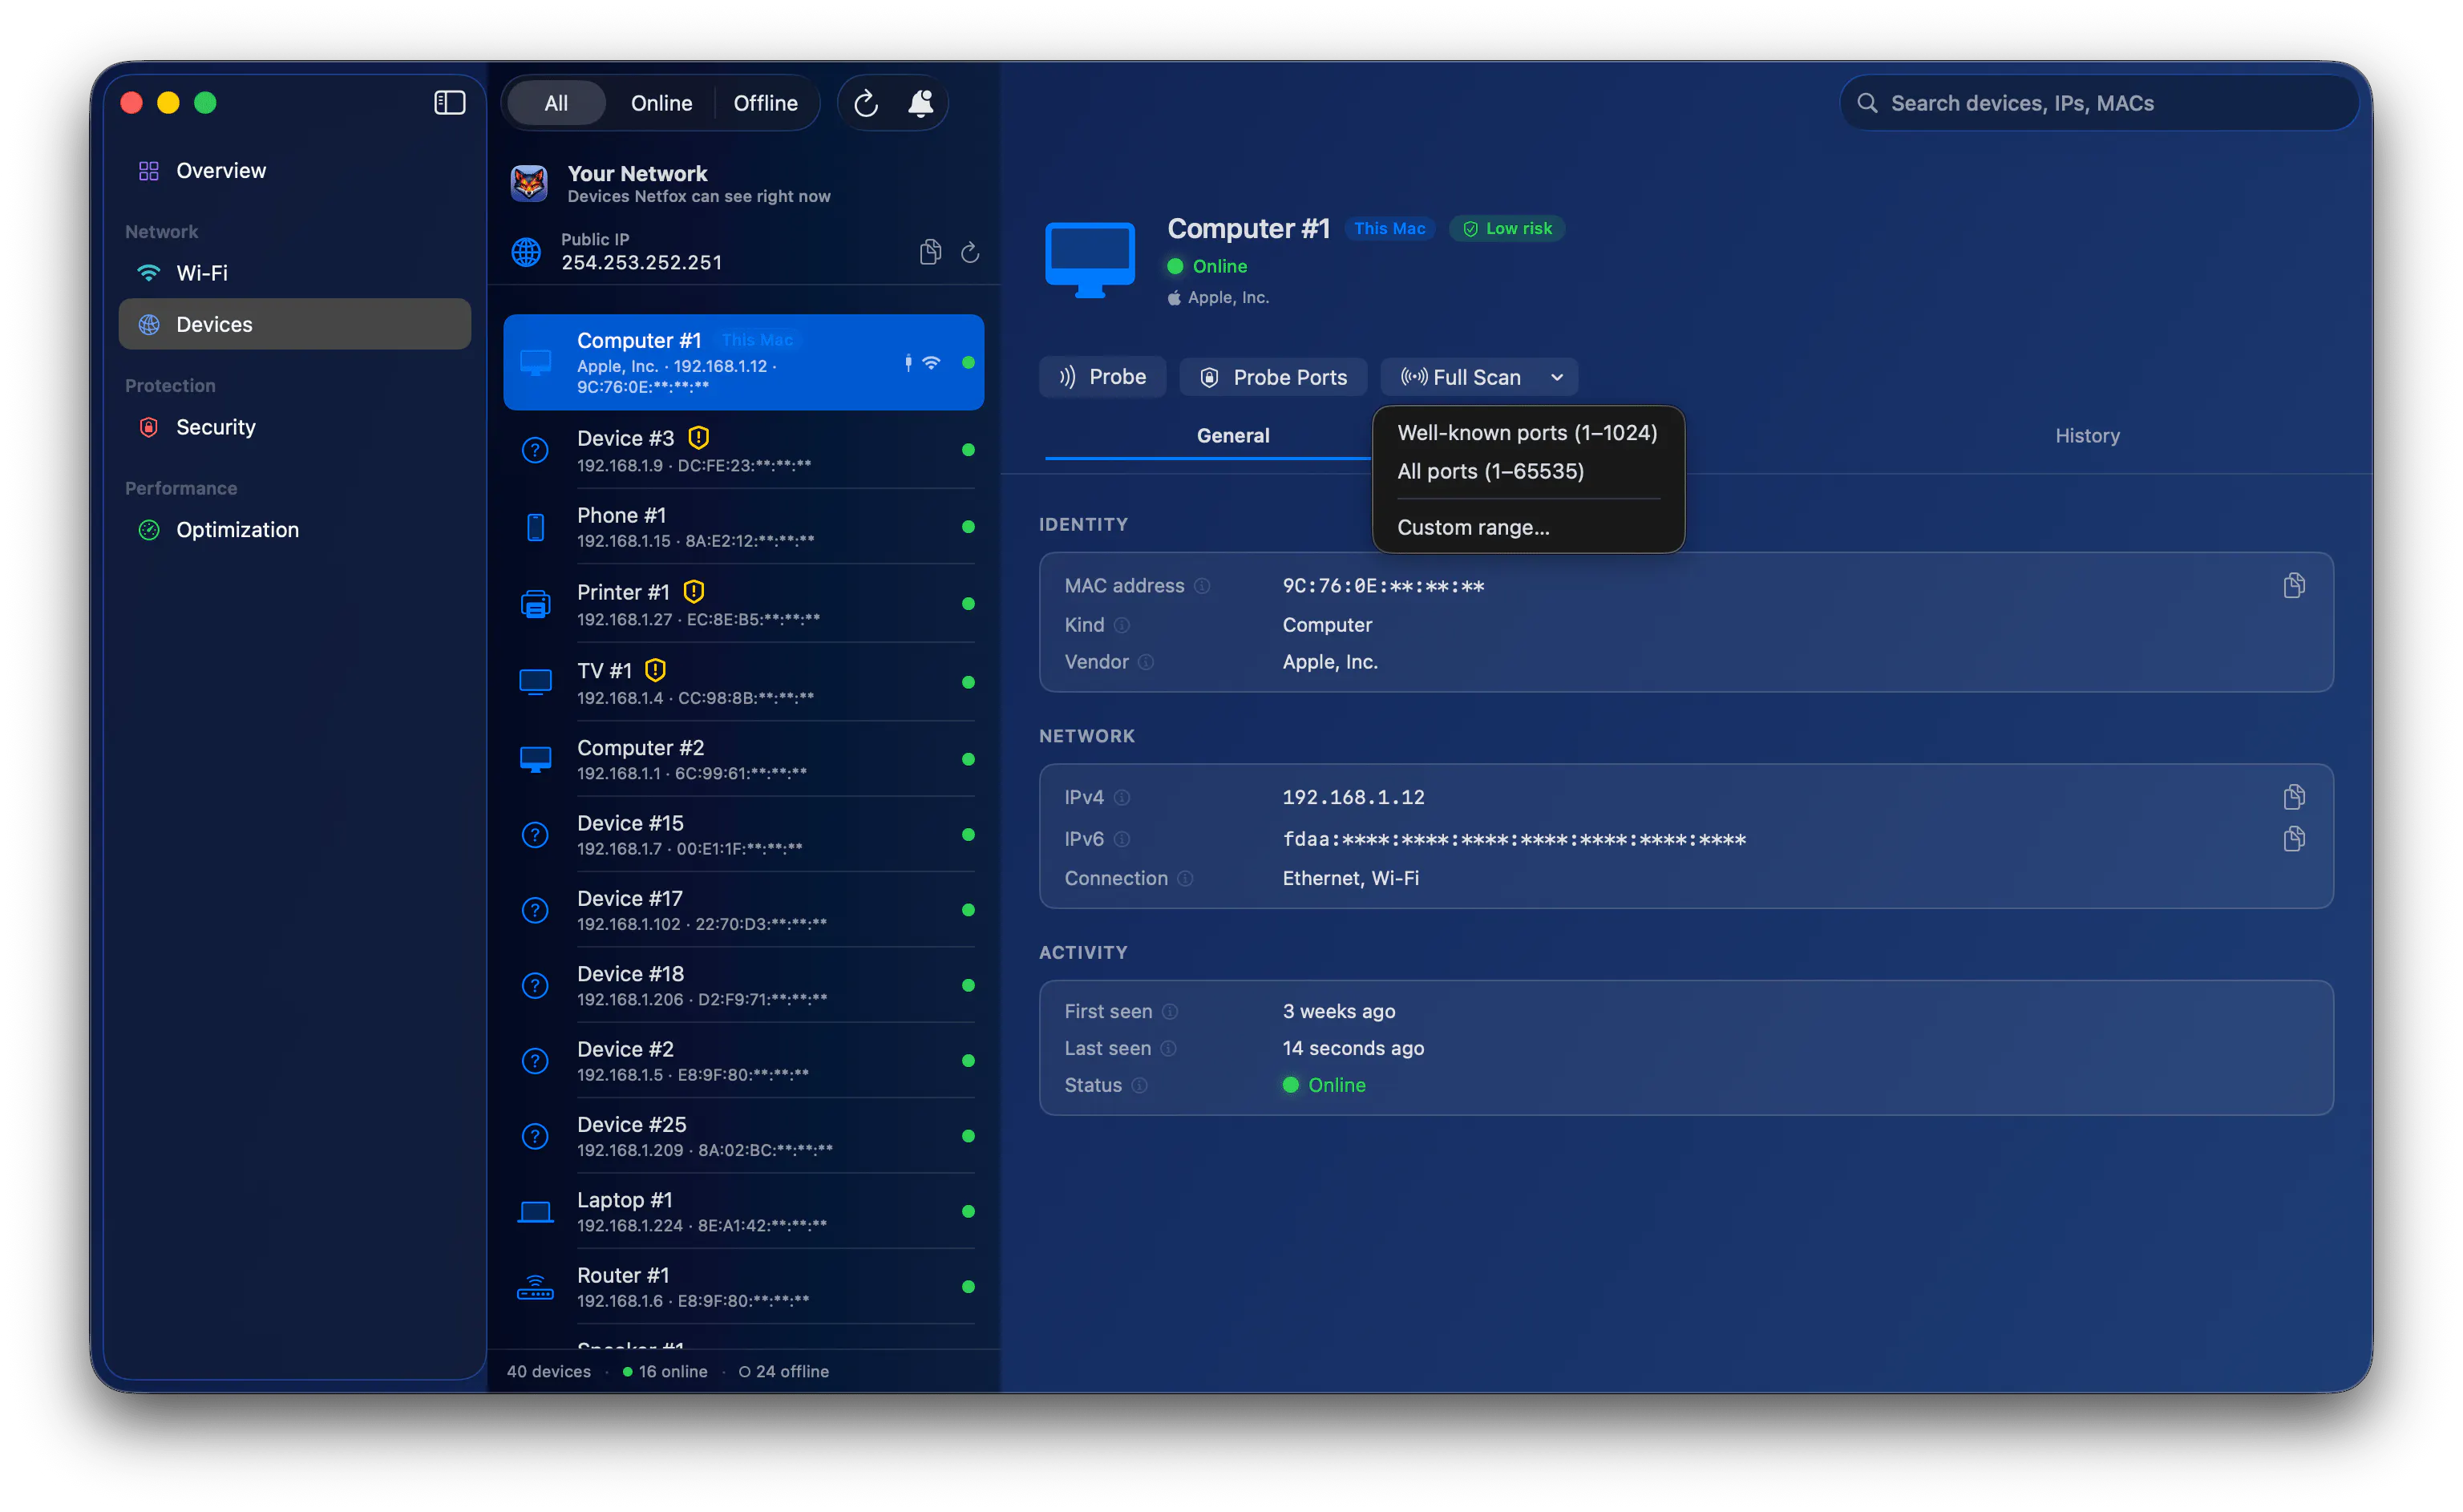
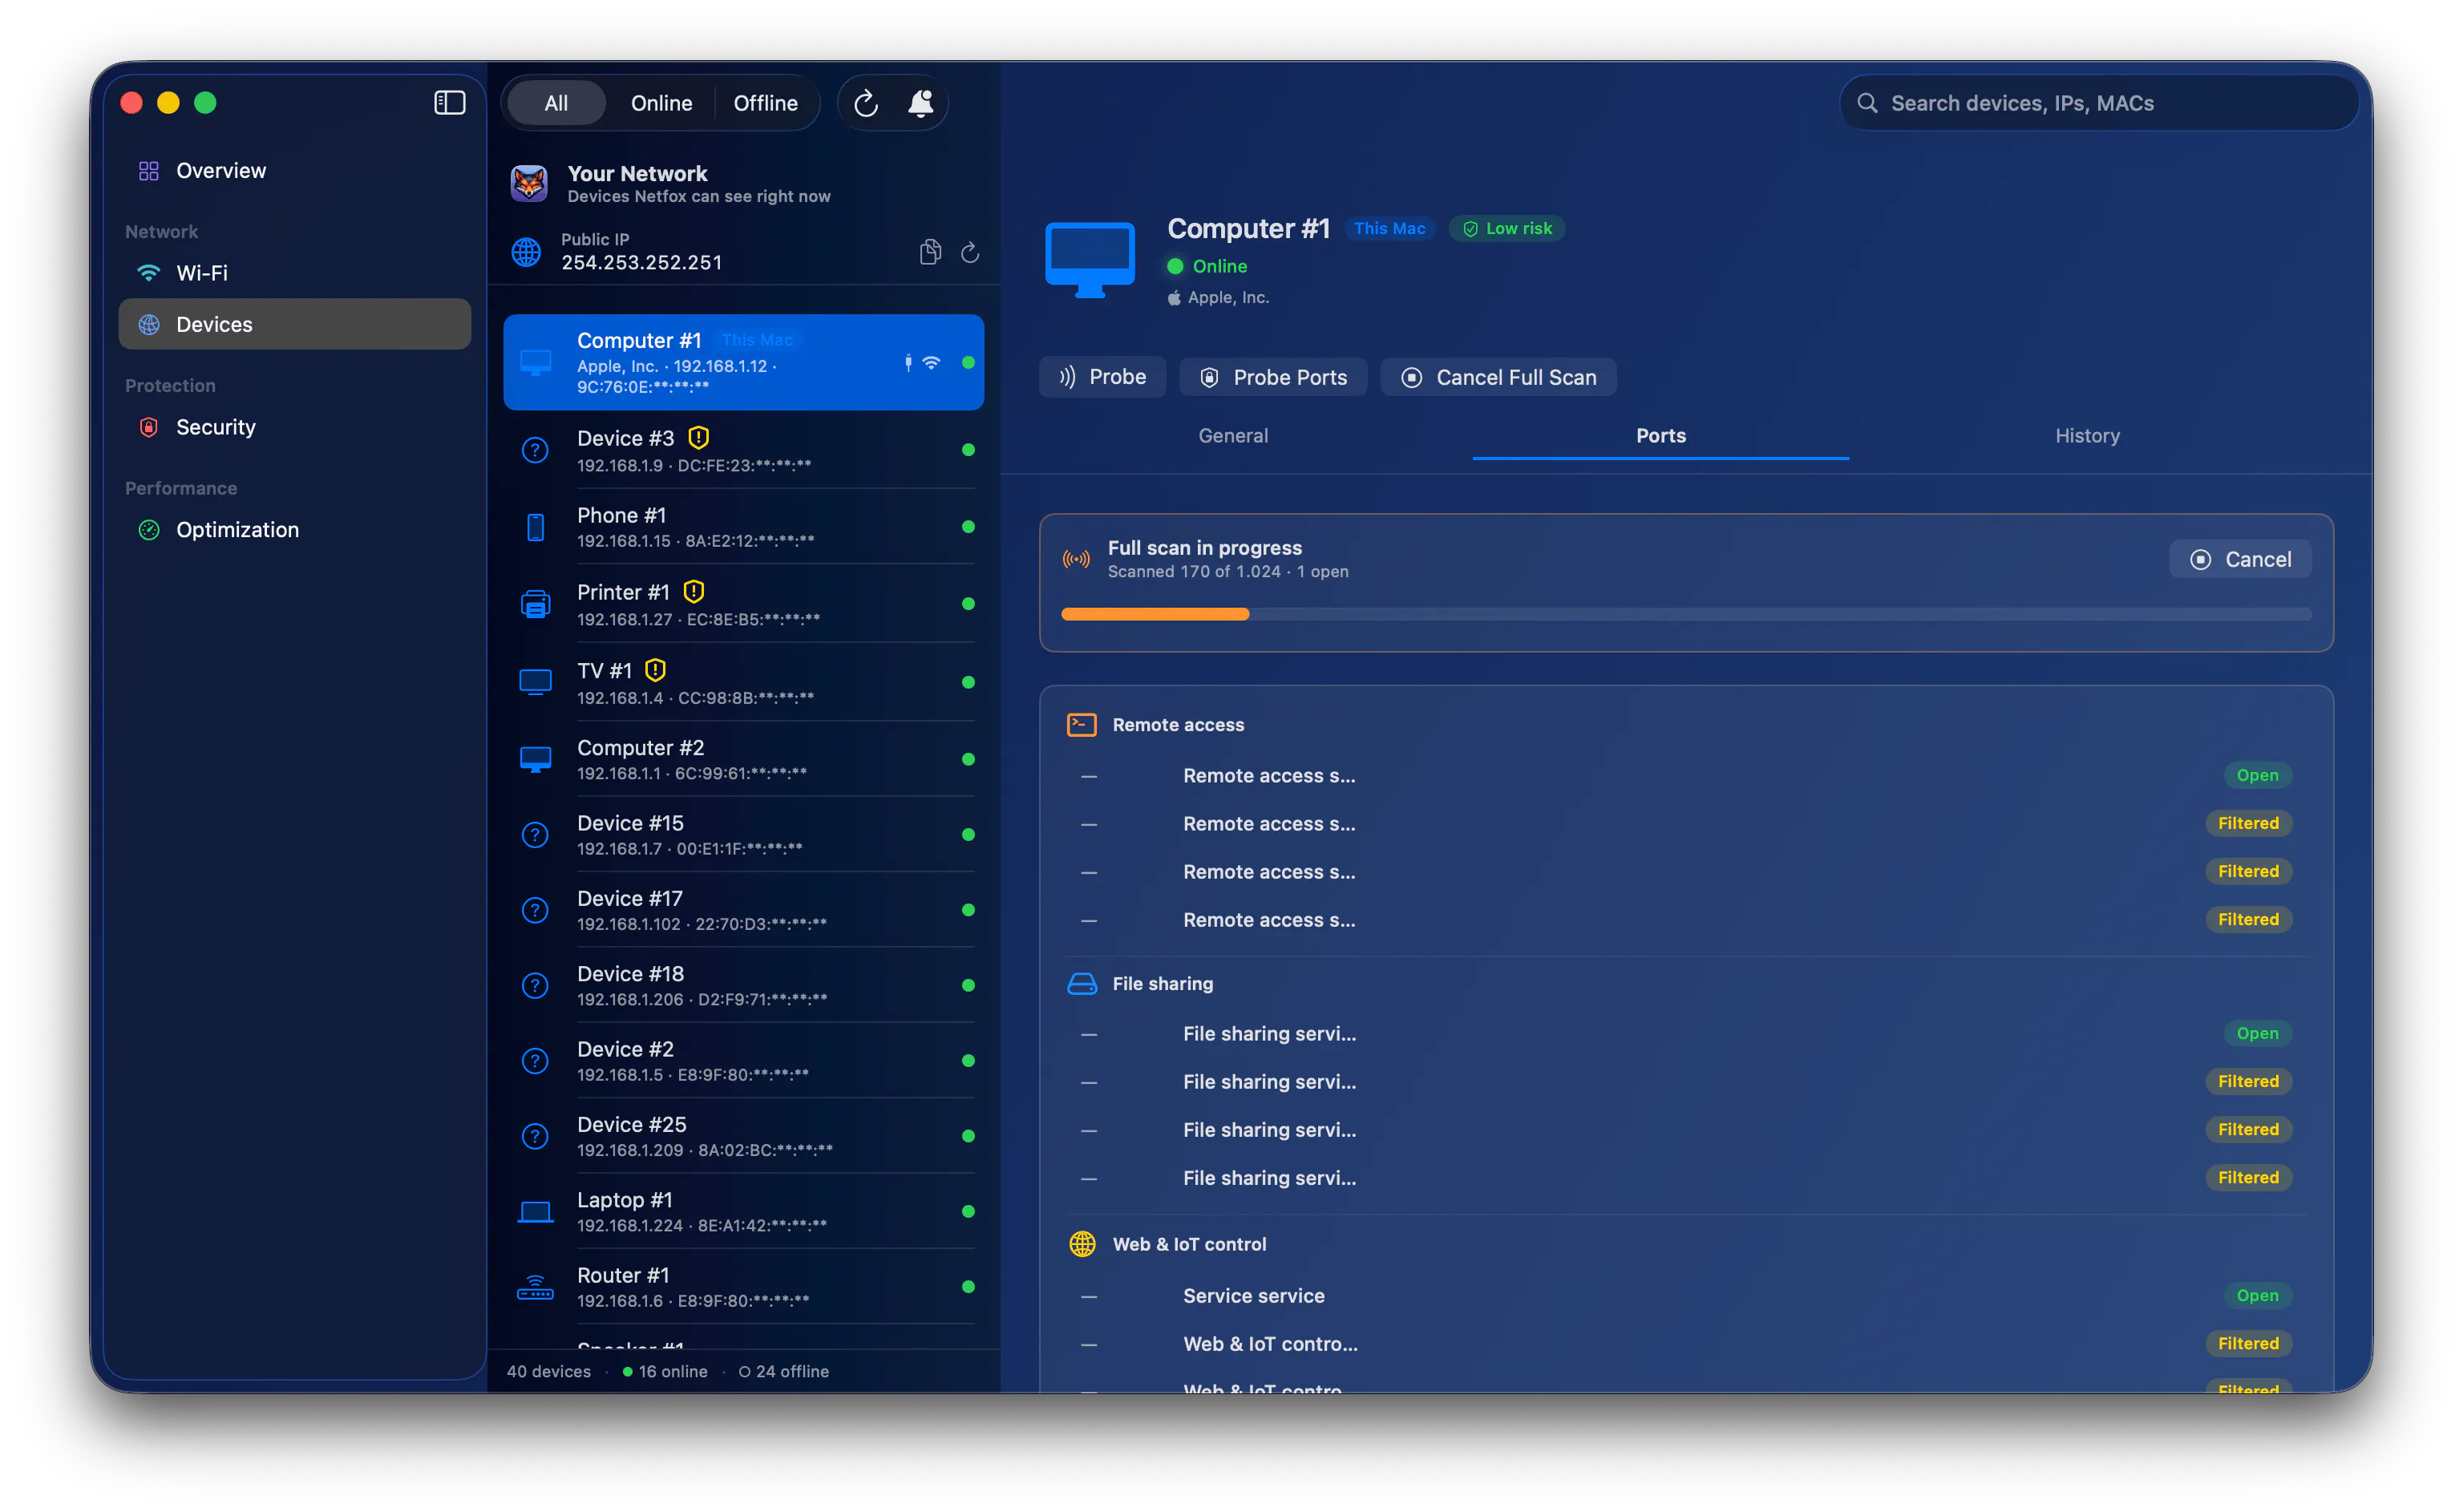
The curated catalog is fast and quiet, the right default. When you want to dig deeper on one device, Full Scan sweeps a wider range — well-known ports (1–1024), all 65,535, or a custom range you type — with a live progress bar and a running count of open ports. Cancel any time. It's per-device and never part of the scheduled sweep, and it stays polite to your router.
🕓 Port history
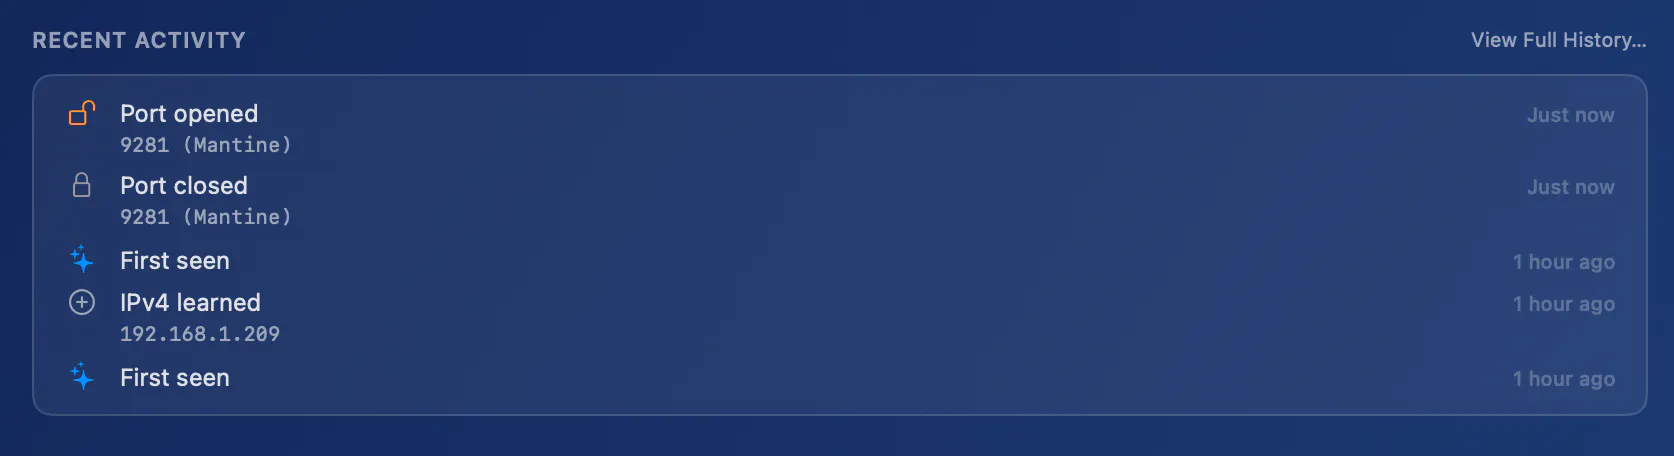
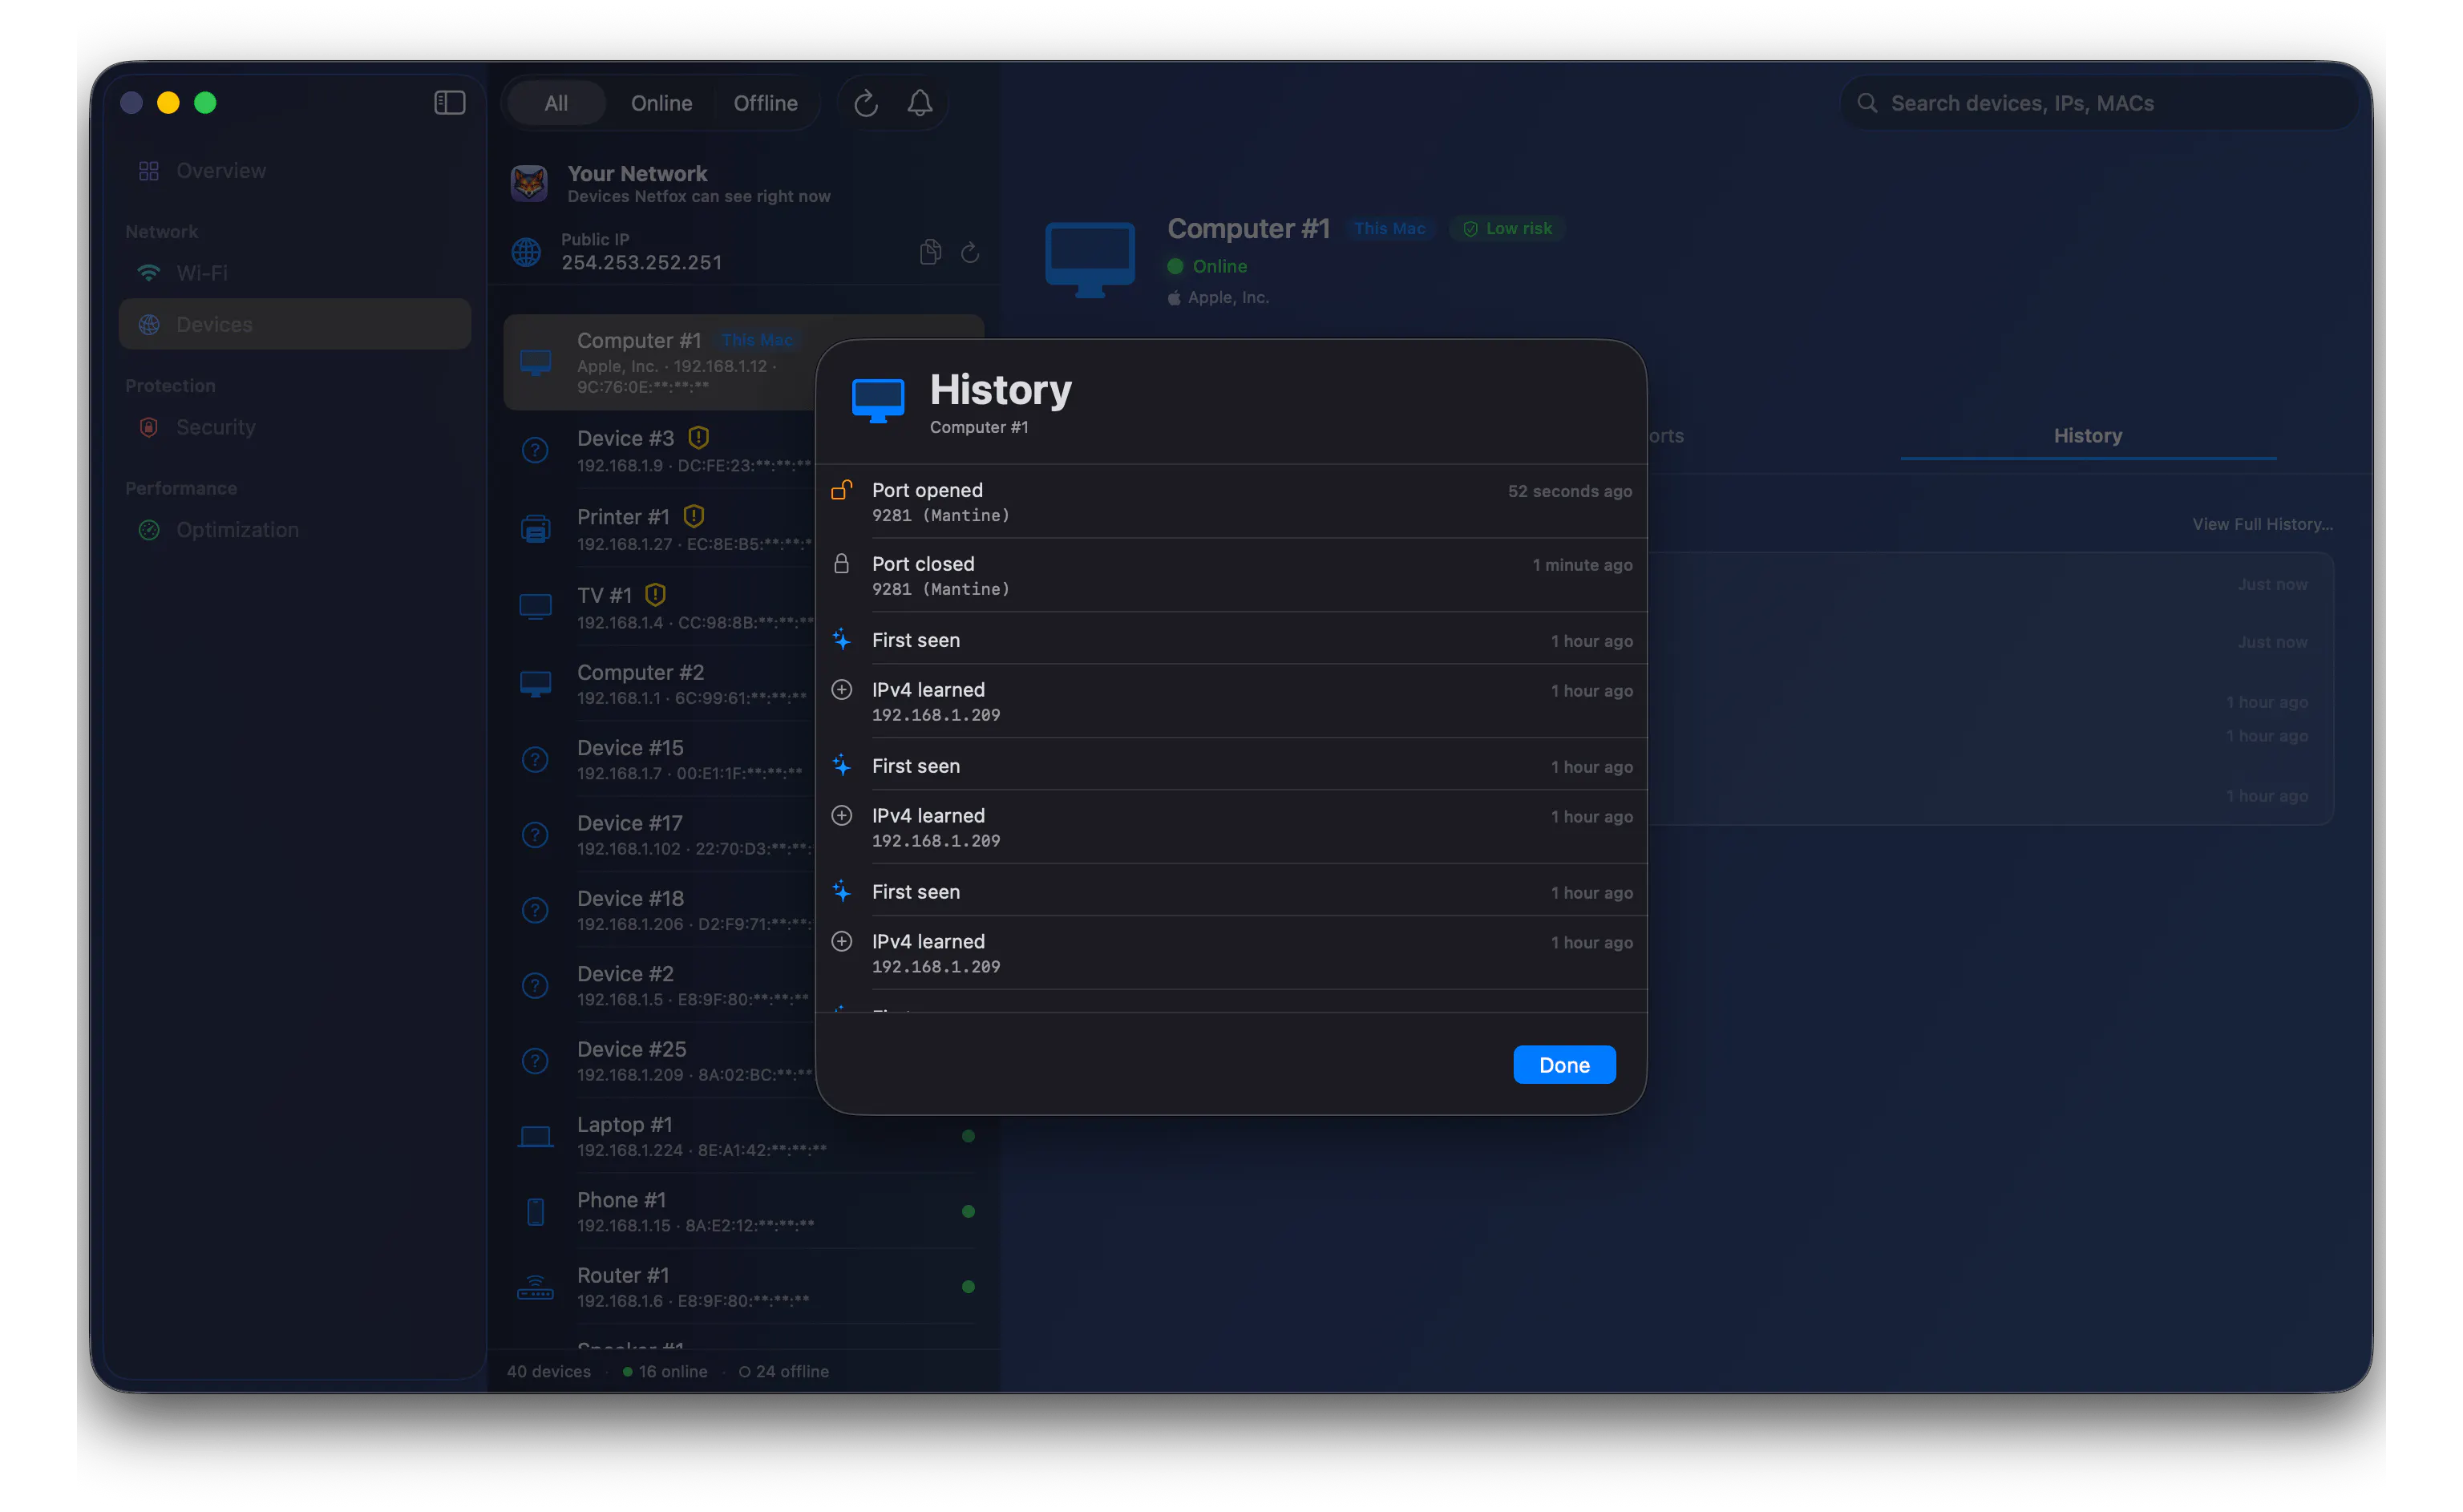
The device History timeline now records when a port opens or closes, so you can see that a dev server ran on :3000 yesterday evening even though it's gone now — service exposure over time, not just presence.
🔔 Port alerts can include this Mac
The "new port opened" alert can now optionally cover your own Mac — an unexpected listener on your own machine is worth knowing about. On by default once you've enabled port alerts; flip it off if your dev workflow is noisy.
🎛️ Custom ports, now a list
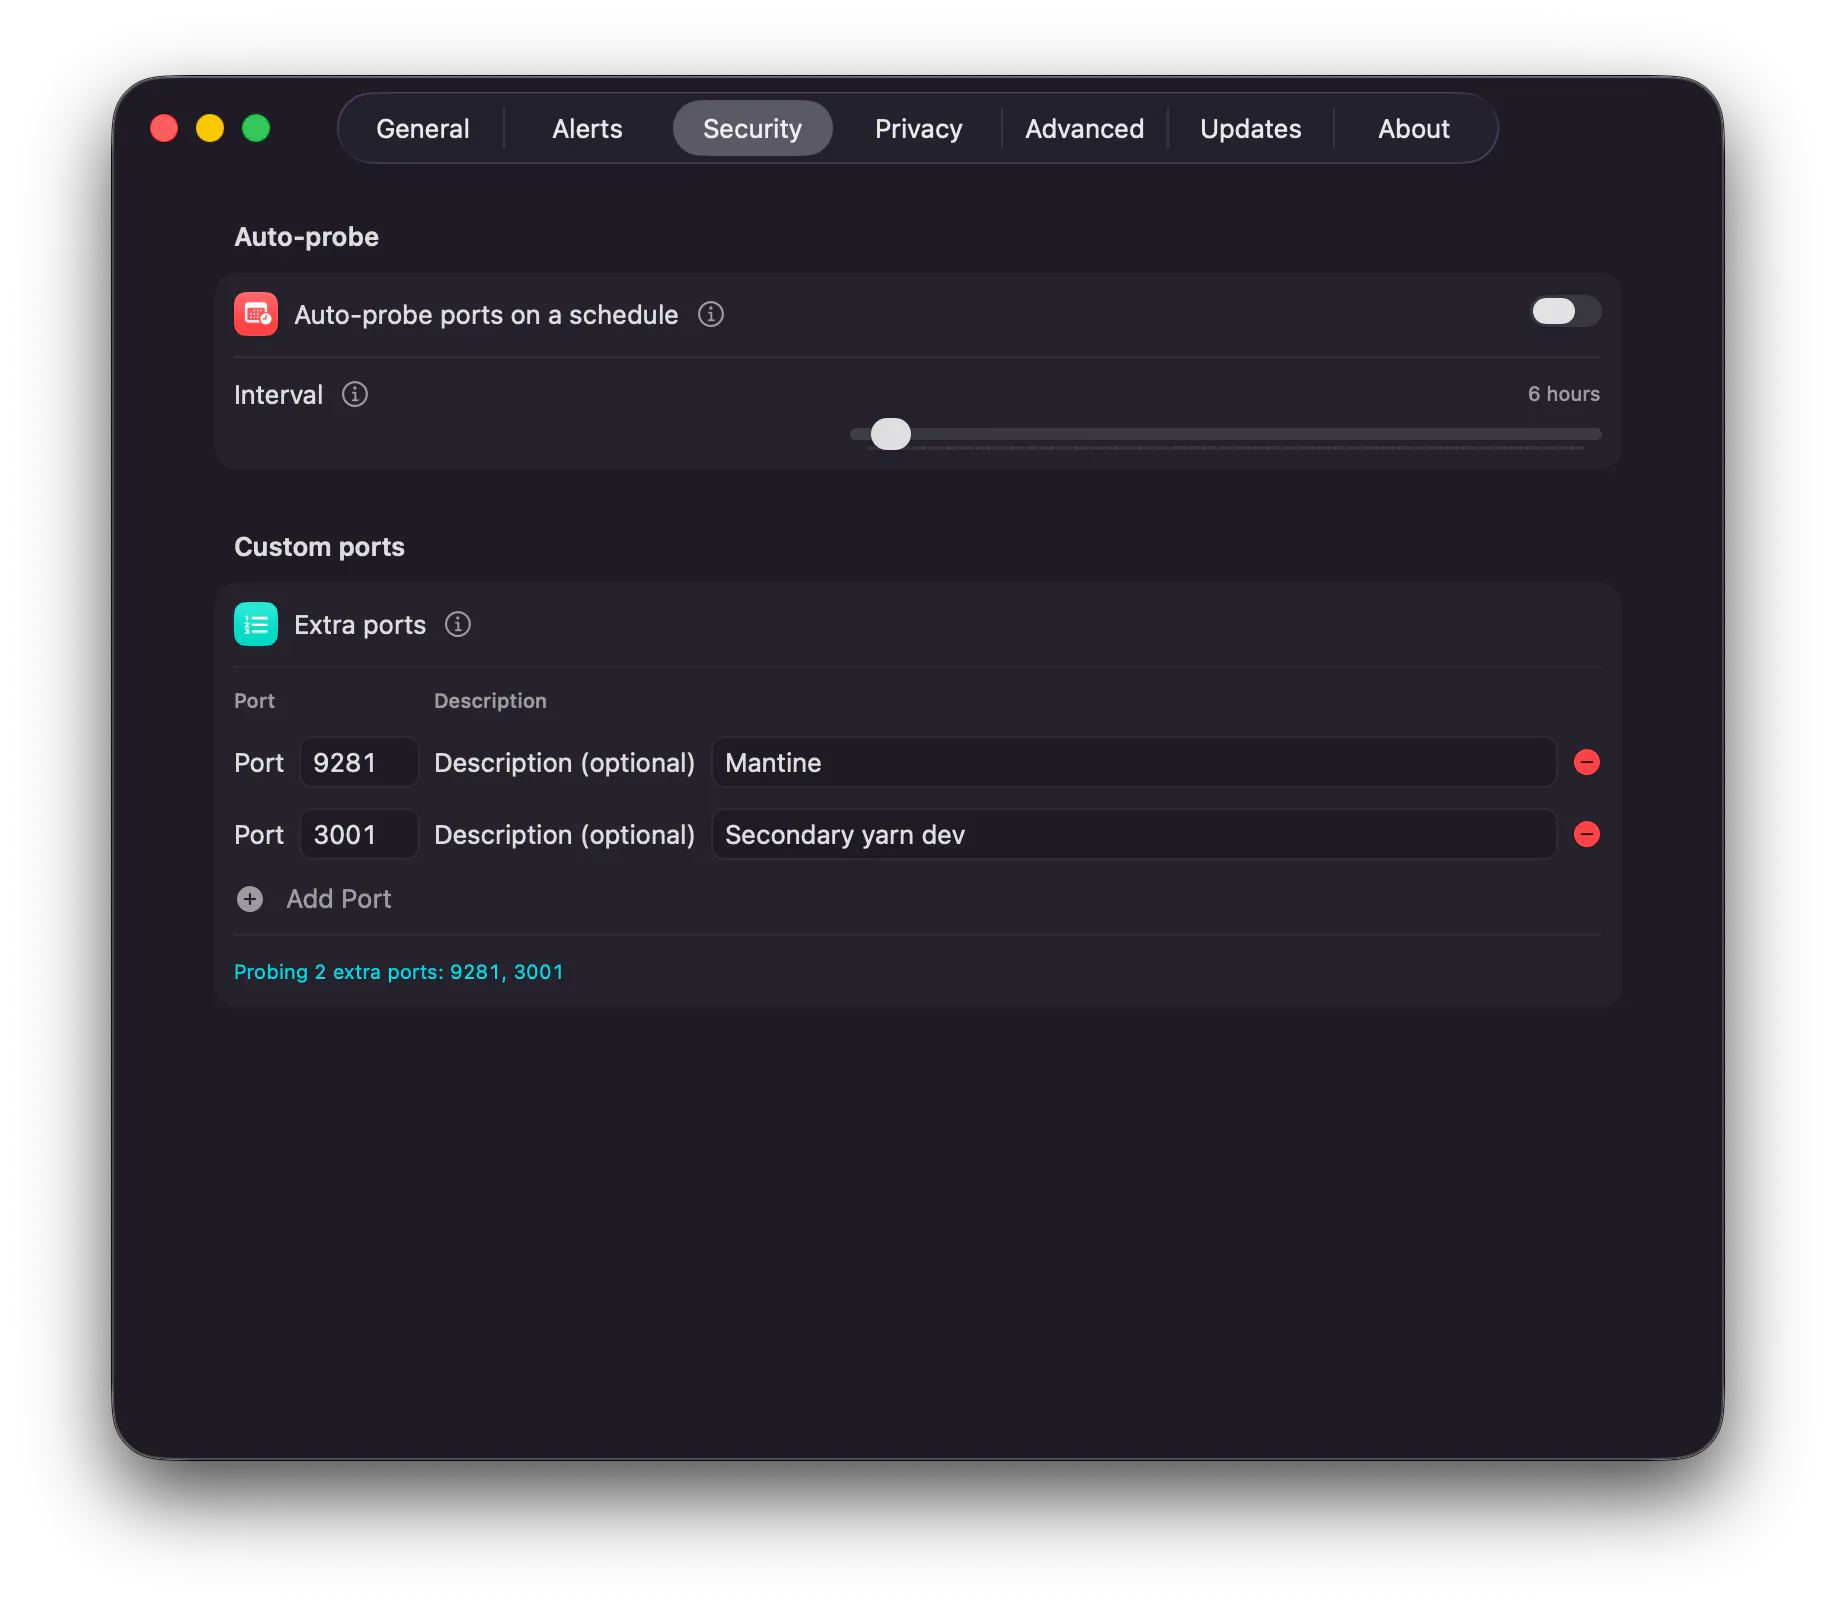
Settings → Security → Custom ports is a proper editor now: one row per port with an optional description, add and remove buttons, and a scrollable list — no more free-text field.
✨ Settings, refreshed
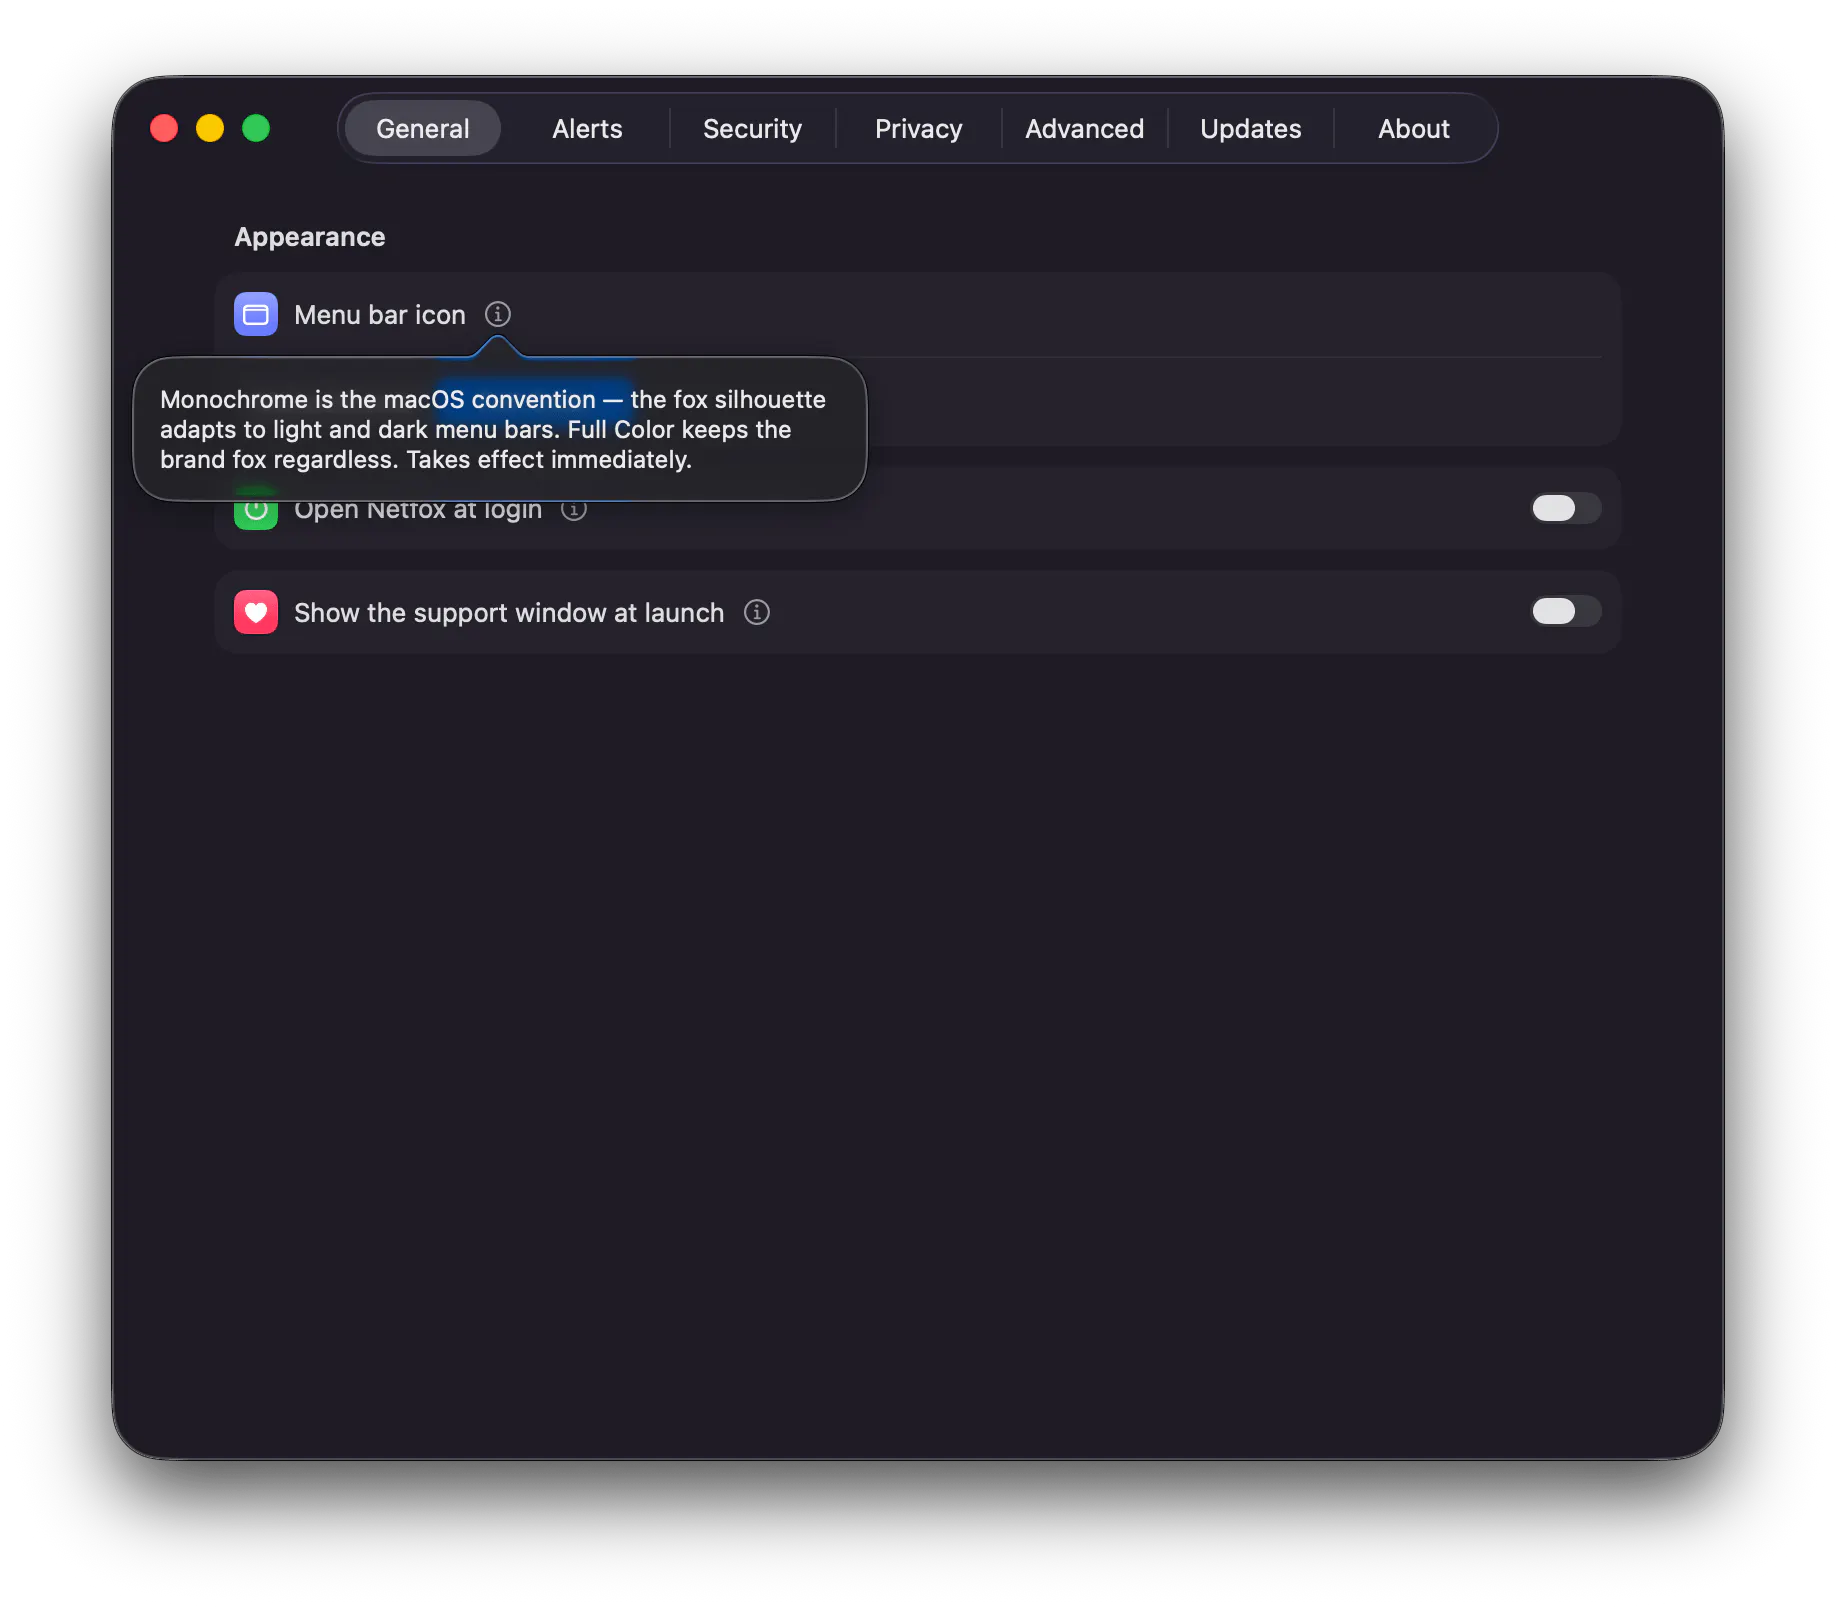
Every setting gets a colour icon for quick scanning and an info button that opens its full explanation in a popover, so the panels stay clean while every detail stays one click away.
⭕ Ring gauges
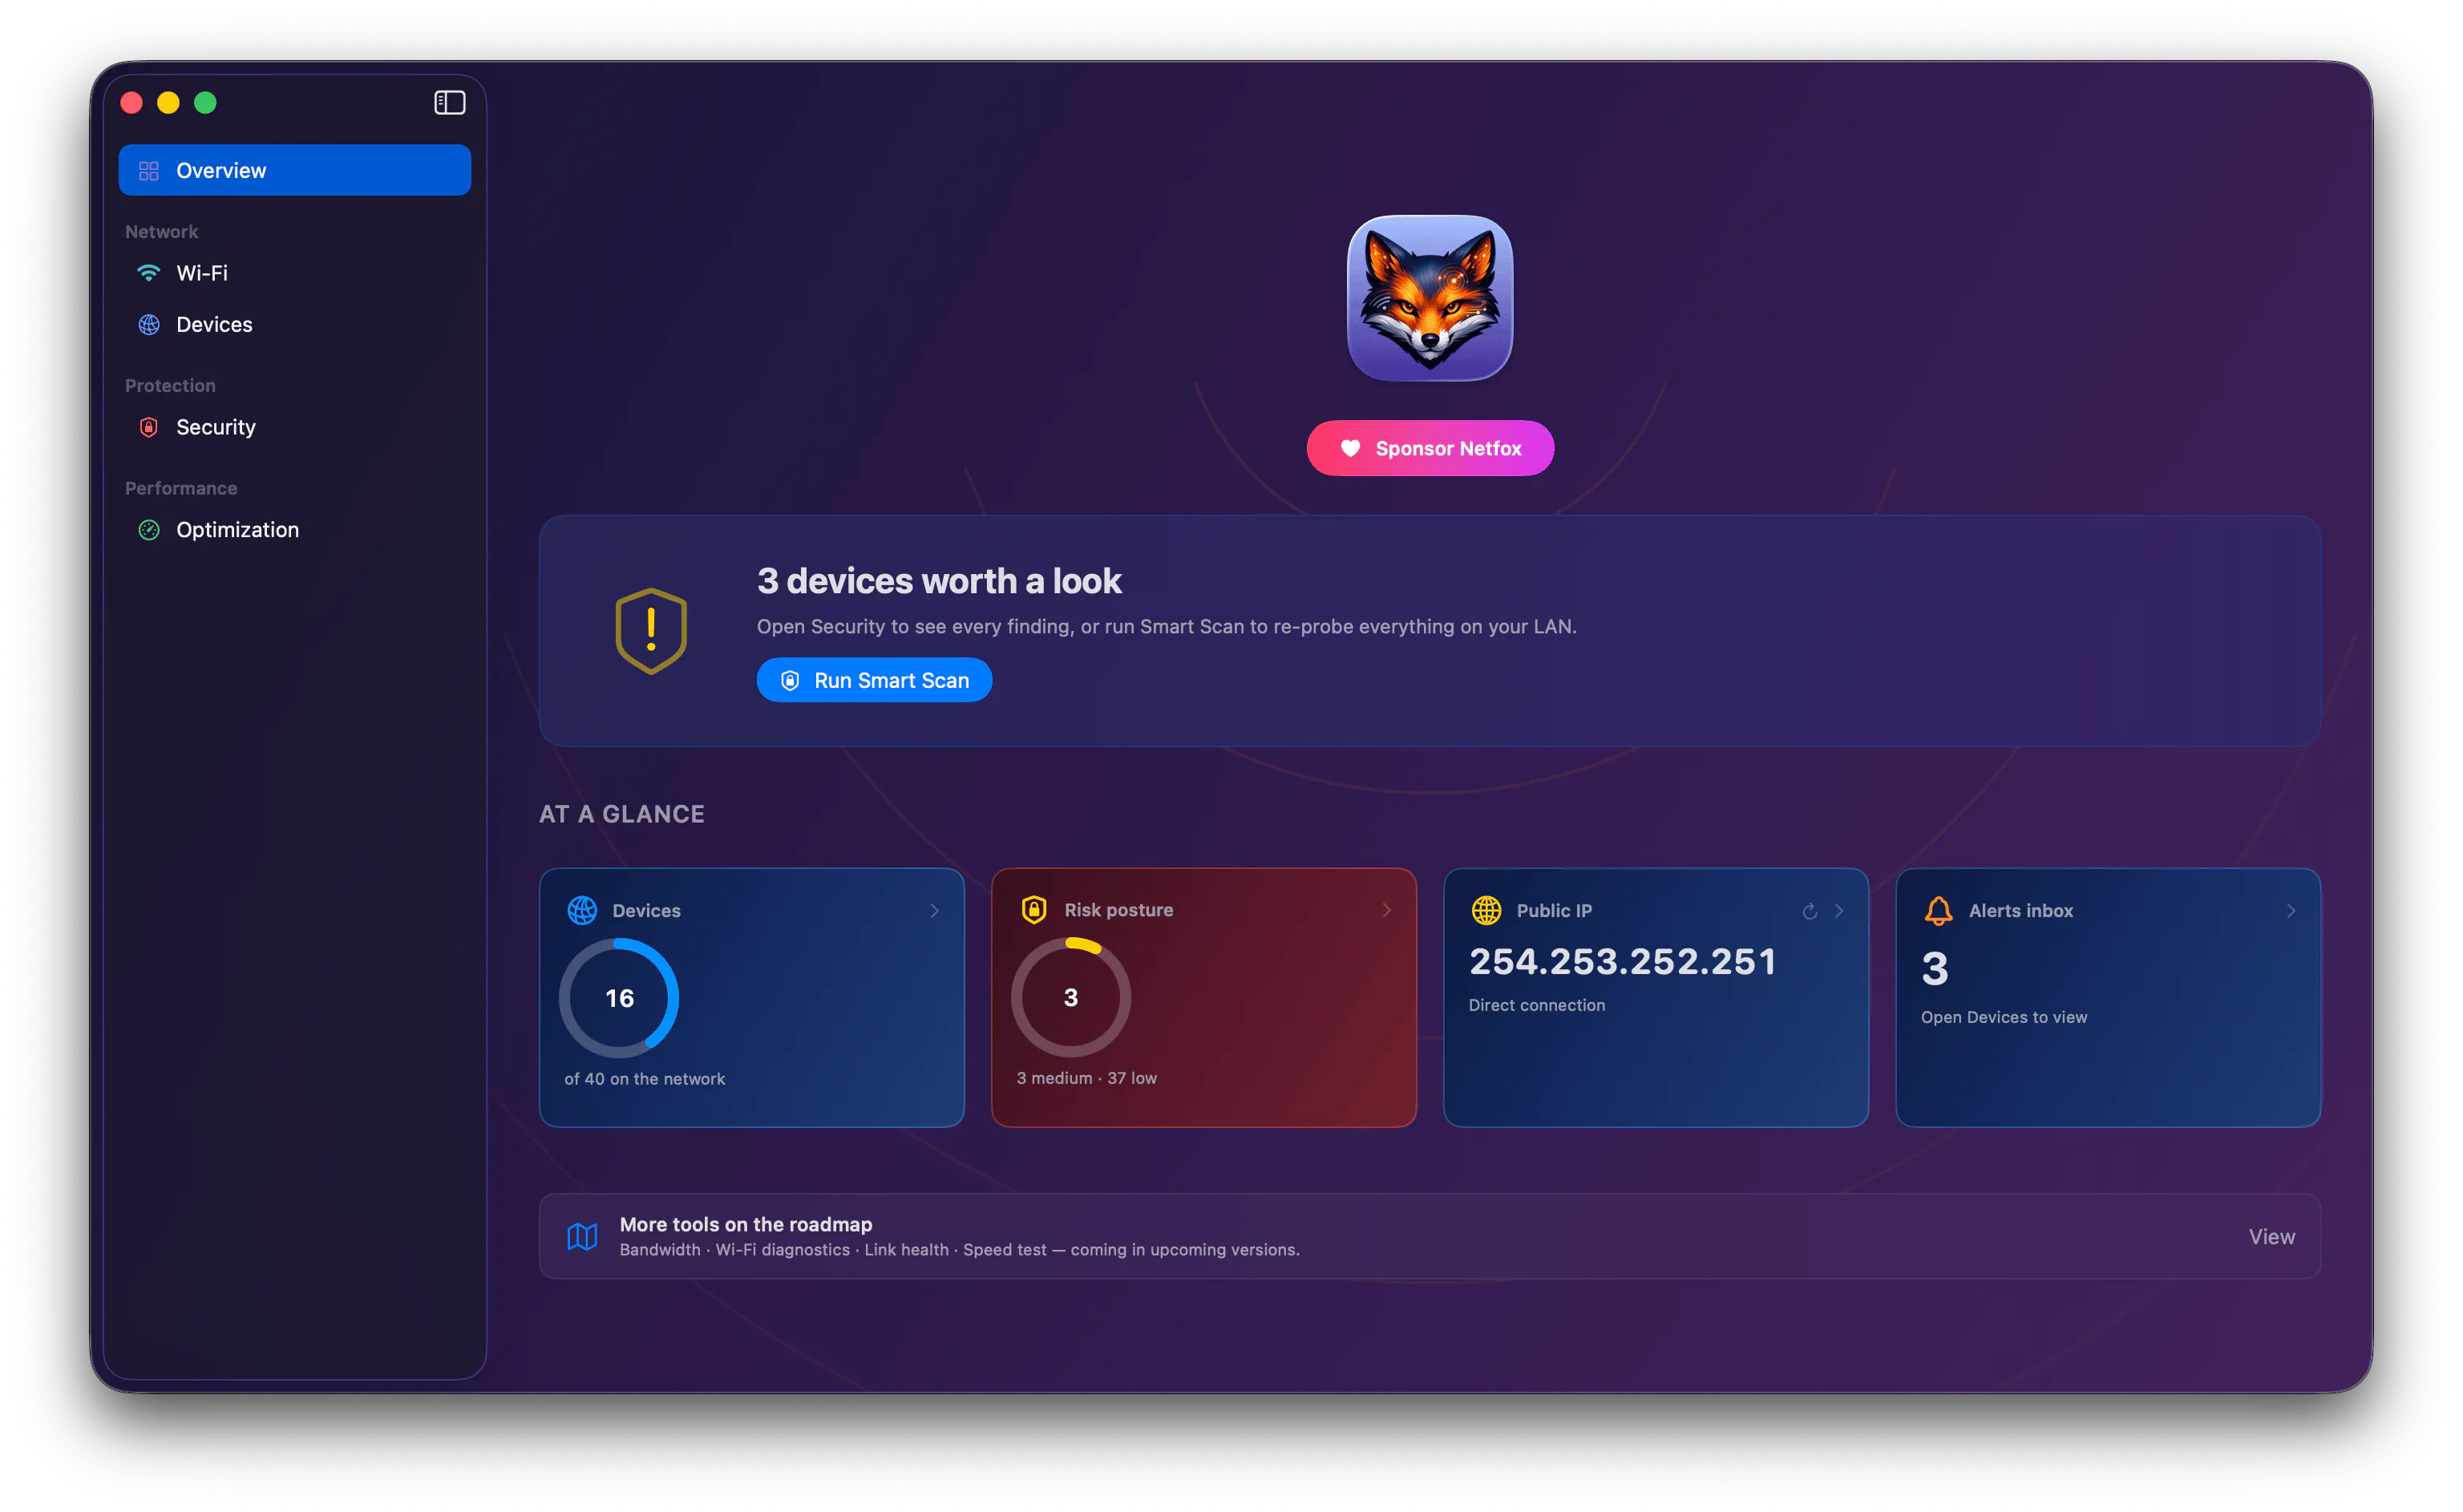
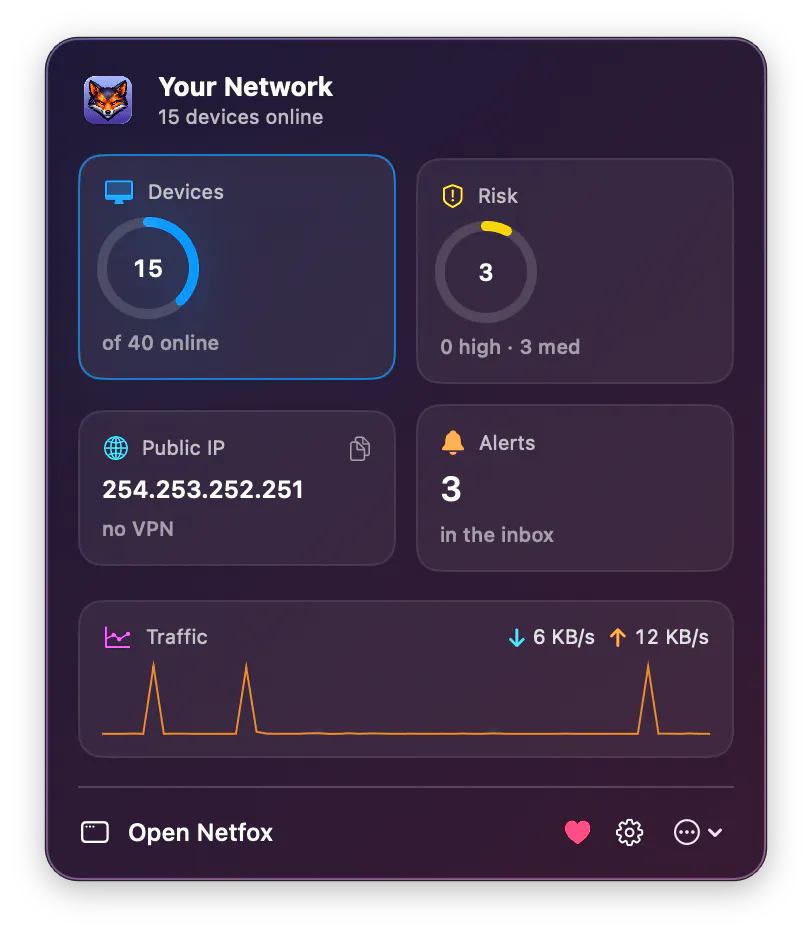
The menu bar popover and the Overview now show Devices (online / total) and Risk (share at risk) as at-a-glance rings, tinted by severity.
Plus polish: relative timestamps now read "Just now" for fresh events instead of the odd "in 0 seconds".
Update via Netfox → Check for Updates…. As always, I'd love to hear what you'd like to see next 🦊
Replies
very cool, can be super helpful for my homelab setup
Netfox
@angsak6 Homelabs are honestly the perfect use case 🙌 Lots of services spinning up and down, easy to lose track of what’s reachable across the LAN. Would love to hear how it works out for your setup — and if there’s anything homelab-specific you’d want to see next!
@gfazioli One small feature request if possible. I use prometheus + grafana for monitoring my homelab, is it possible for you to expose an prometheus compatible endpoint and expose some metrics like open ports etc etc so that I can connect it directly to my grafana charts ?
Netfox
@angsak6 Hi, thanks for the suggestion 👏 — this is a great fit for Netfox and I like it a lot.
The plan could be to add an optional, opt-in HTTP endpoint that exposes metrics in the Prometheus text exposition format (for example, http://:9090/metrics). This would let you point Prometheus directly at it and build your Grafana panels.
I'm planning to expose things like: open ports per host, port state, devices online / by kind, alert counts by type, and Mac throughput (up/down). It'll be off by default, with a configurable port, and the option to bind it to the LAN (so a Prometheus running on another host can scrape it) 🤔
Two quick questions to prioritize:
1. Does your Prometheus run on the same Mac, or on another machine on your network?
2. Which metrics matter most to you first — open ports, device presence, something else?
I'll keep you posted here once it lands.
@gfazioli
1. open ports
2. last accessed time per port
3. device state
4. last ping status
these things will help
Netfox
@micah_preston @maxwell_dean You both nailed exactly why I built it. Most network tools only answer “what’s open right now?” — but when something goes wrong, the real question is “what was exposed last night at 2am?” Port history turns Netfox from a live dashboard into something you can actually investigate with...
That dev server that ran on :3000 for ten minutes? Now there’s a record. Really glad this resonated — it’s the feature I’m most excited about in 0.7 🦊