

We tracked 33 cloud resources across 5 providers - here’s what changed

We’ve been building a cloud pricing history feature for Cloud World Model, and we just published our latest snapshot covering November 2025 through August 2026.
Across the 33 resources we tracked:
Google Cloud decreased by an average of 5.3%
AWS showed no material average change
Azure showed no material average change
Oracle Cloud increased by an average of 1.1%
DigitalOcean increased by an average of 3.9%
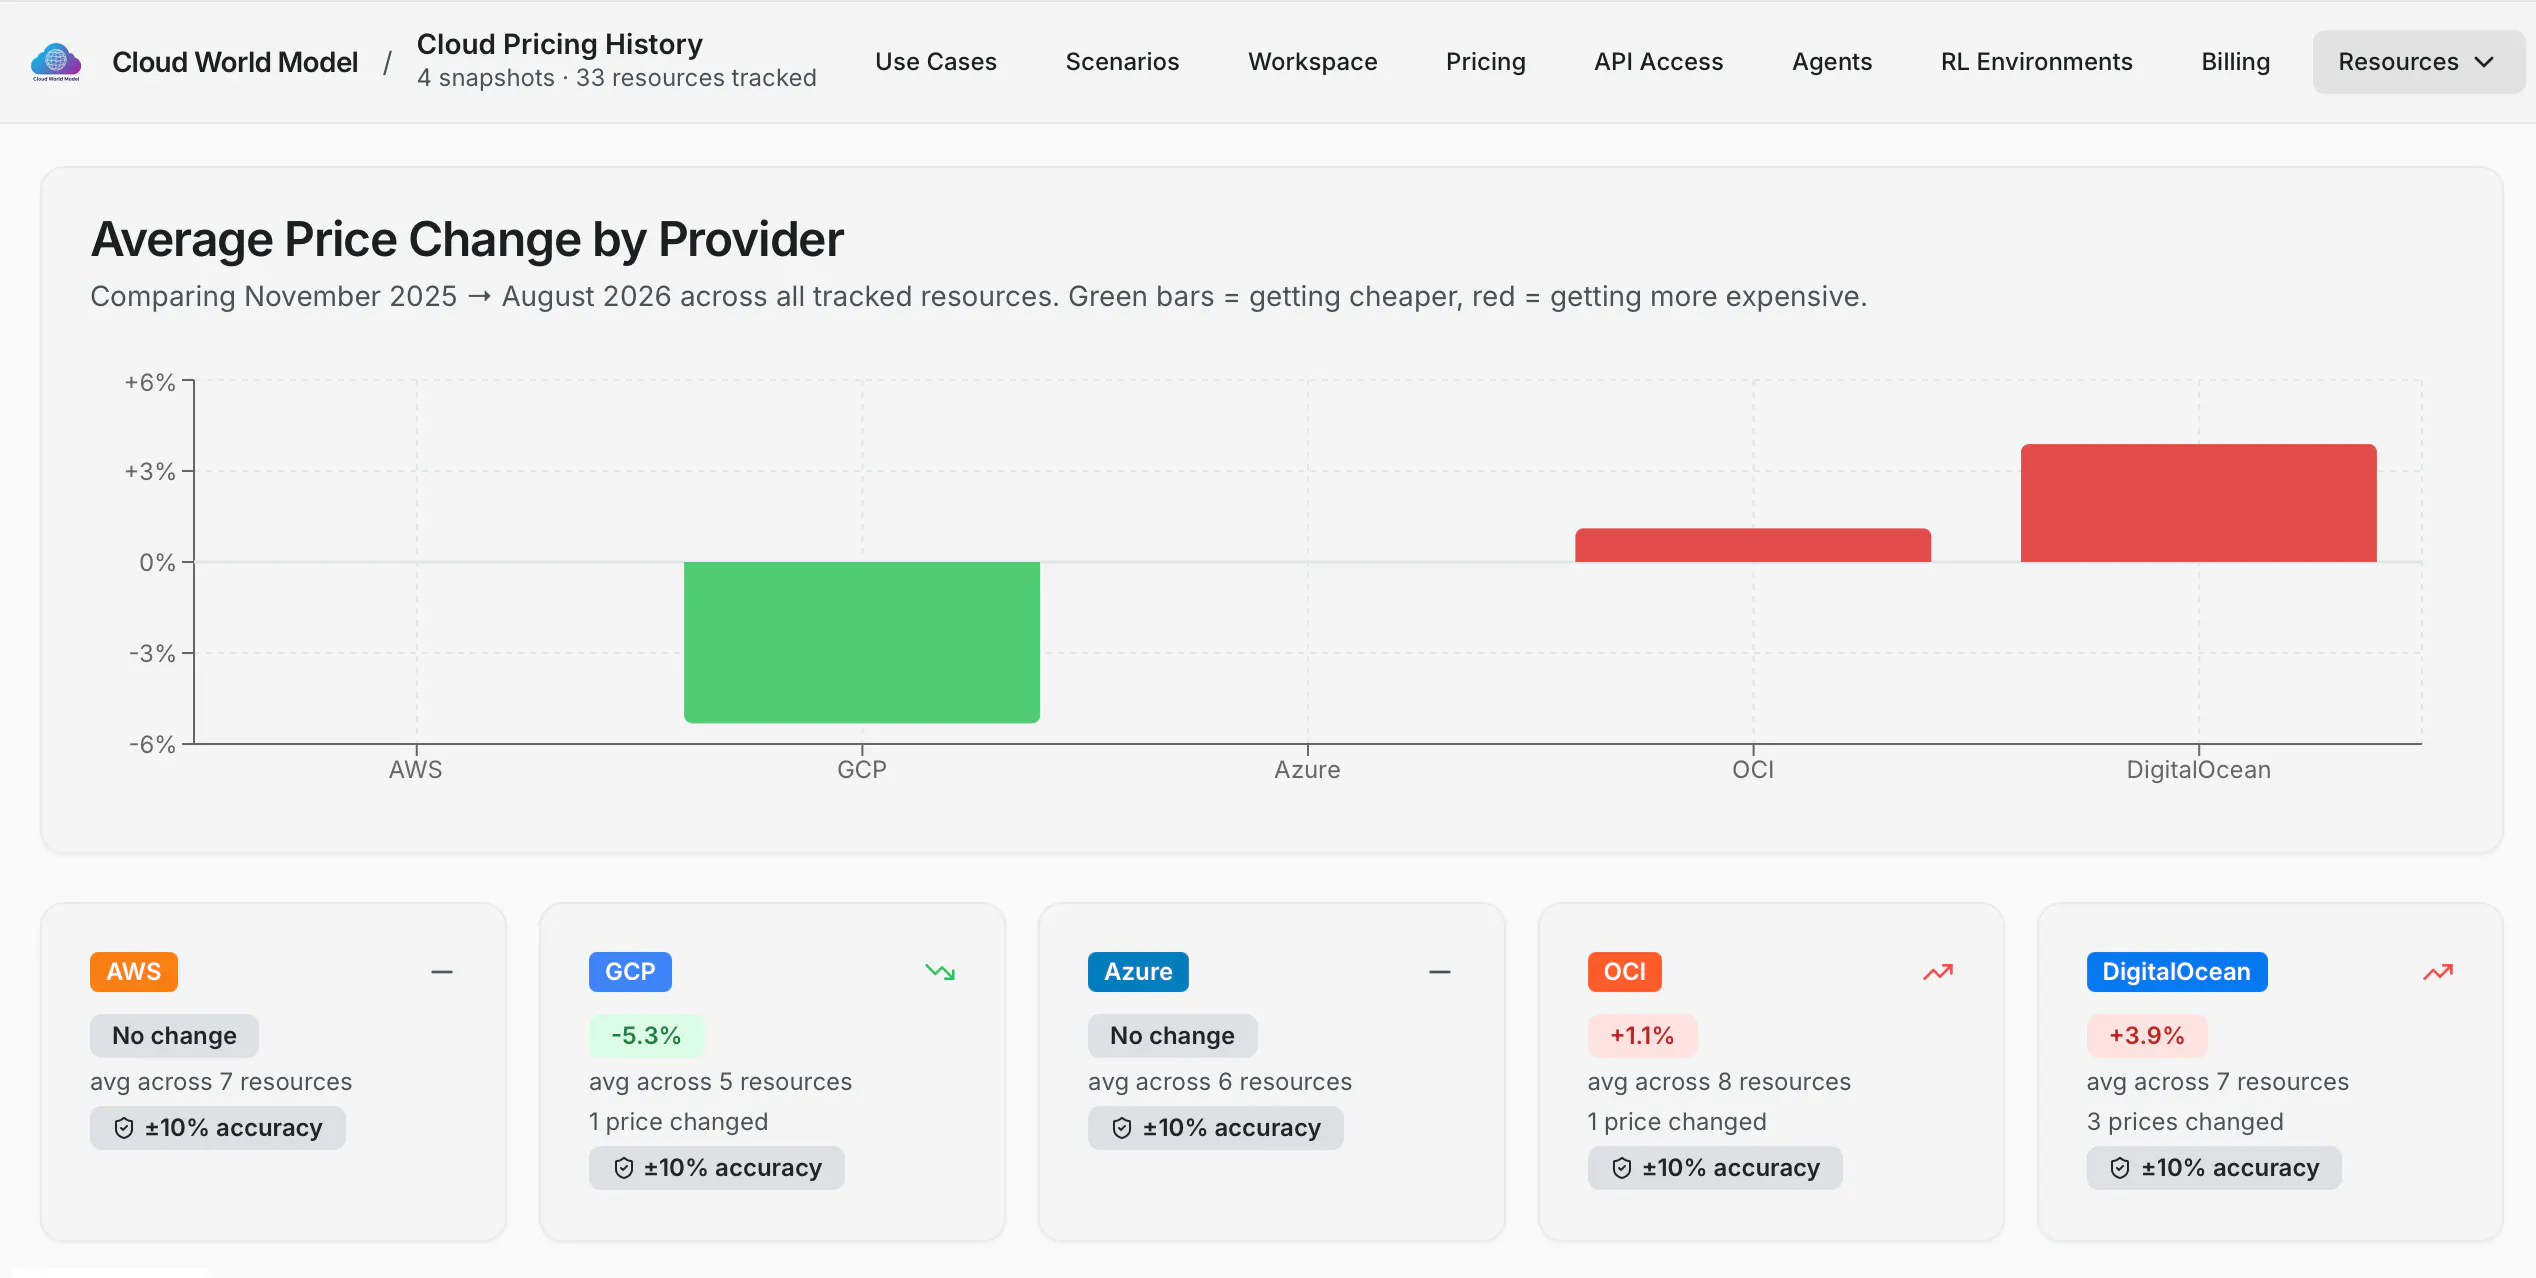
The changes are not dramatic, but that is part of what makes cloud pricing difficult.
Small shifts can still affect architecture decisions when they are multiplied across regions, workloads, environments, and months of usage. Pricing pages also change quietly, so teams can easily keep designing around assumptions that are no longer current.
We’re exploring how historical pricing data could help developers and AI agents:
compare architecture options using current costs
identify meaningful pricing changes
estimate how design decisions affect long-term spend
avoid relying on stale pricing assumptions
Here’s the full analysis:
https://www.cloudworldmodel.ai/blog/cloud-pricing-trends-august-2026
I’d love feedback from the Product Hunt community:
Would cloud pricing history be useful in your architecture workflow? What would you want it to track or compare?
Replies
Dial
one thing i'd want to know before acting on the -5.3% GCP number: is that a flat average across all 33 resources, or weighted by how much each one actually gets used. a handful of niche SKUs getting cheaper can drag the average down even if the compute/storage types most people actually deploy didn't move at all. curious whether the per-resource breakdown is public somewhere, that'd matter a lot more for an actual architecture decision than the blended number
Cloud World Model
@omri_ben_shoham1 Hey Omri, thanks for the question. let me know, if this is confusing. Basically, one price drop that we tracked caused gcp number to go down.
The per-resource breakdown is already public at https://www.cloudworldmodel.ai/pricing-history. You can see directly on the GCP card: "avg across 5 resources, 1 price changed." Filter by GCP and you get the full rate history for each shape individually.
To your question: it's a flat average, not usage-weighted. One resource drove it, Cloud SQL db-n1-standard-2 dropped from $0.184 to $0.1351/hr (~27%) when GCP introduced a bundled SKU in June. The other 4 (e2-medium, n2-standard-4, db-f1-micro, Cloud LB) are unchanged across all four snapshots back to November 2025. So if you're not running Cloud SQL at that tier, your GCP compute costs haven't moved.
The headline number is accurate,it's just the average of what we track. The interactive page is the right place to filter to the specific shapes you actually deploy.
Dial
that's a great answer, most people would've just said "it's an average" and left it there. naming the specific SKU and the specific date the pricing changed is the kind of thing that makes the tracker actually trustworthy instead of just a number on a page. makes sense, thanks