WebDataRocks Pivot Table

Free JavaScript library for data visualization & analysis

4 followers

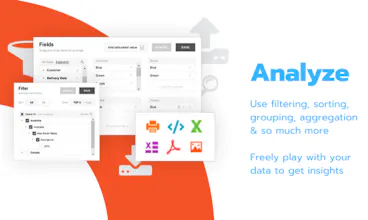
A feature-rich web pivot table component for creating insightful interactive reports. Integrates with any front-end technology. Can easily become a part of your application or website.
WebDataRocks Pivot Table gallery image
Launch Team
ace.me
ace.me
Your new website, email address & cloud storage
Promoted

What do you think? …

Guido Arata
Sounds really cool, currently I'm using Webix Pivot library, will check out yours! Curious about your business model, can you please provide me some infos? Thanks and congrats
Veronika Rovnik
@guidoarata Hi Guido! Thank you for your interest in our product :) We do hope your experience with WebDataRocks will fulfill your expectations! You can use it for free both for internal reporting or in a commercial project that delivers reporting & data analysis functionality to your end-users. As you're an active user of a pivot table, your feedback is especially important for us! So, please feel free to leave comments or suggestions of any kind :) Have a great day!
Guido Arata
@veronika_rovnik ya thanks, my question was more like: if your tool is free now, how do you plan to sustain it on the long run? Do you have a business plan behind it? It's just a side project? Thanks
Veronika Rovnik
@guidoarata We made it pretty stable and now we are releasing some improvements with the idea and purpose to have a strong community of true data viz fans :) And we don't have plans to make this tool a commercial one. Of course, at the same time, our team has some other projects.
Guido Arata
@veronika_rovnik thanks ok!
Guido Arata
@veronika_rovnik I was checking the demo of the tool and it sounded familiar with another, Flexmonster. And I actually saw your demo bottom-right a powered by Flexmonster. But now I'm getting lost....haven't you developed a pivot JS library? If yes, how can it be based on another, commercial, pivot JS library? For sure I'm missing something, can you help me understand? Thanks!
Iryna Kulchytska
Hi Product Hunt community! 👋 I’m Iryna - the founder and developer at WebDataRocks. In the light of the new release, we’re excited to launch WebDataRocks on Product Hunt - a free JavaScript component for web reporting. Our story began in 2018. We had prior experience in data analytics software development and the next logical move was to share this knowledge with others. That’s where the thought of making our own reporting solution that will be affordable for everyone came into being. Designing the product, we considered the most popular pain points in the reporting as well as feedback from developers and data analysts. And that's what came out of it 👇 ✔️Data analysts got all the essential functionality at their fingertips and the power to create reports in minutes. ✔️Developers got a simple way to integrate the analytical component with their web project or application. Let us present the most awesome out-of-the-box features that make our product stand out from the rest. Key features for data analysts👩‍🏫 - Easy connection to CSV and JSON data sources - Interactive report creation with drag-and-drop, filtering, sorting, and aggregating - Layouts for effective data presentation - Built-in export to PDF, Excel, HTML Key features for developers 👩‍💻👨‍💻 - Integration with front-end frameworks made easy: ready-to-use packages for React, Angular, AngularJS and Vue.js - Look & Feel customization with minimum lines of code - An extensive JavaScript API for bringing your custom scenarios to life - Connectors for charting libraries that make integration and dashboards creation totally seamless - A rich collection of examples It’s free. Use WebDataRocks at no cost in any project - whether it's free or commercial. Your feedback is what keeps us moving forward. Can’t wait to hear your opinion😻!
Tkachenko Arthur ~UA~
@irynakulchytska Go Go Go! Viva Ukraine!
Iryna Kulchytska
@arthur_tkachenko Arthur, thank you so much for your support! :)
Veronika Rovnik
We want to say a huge thanks to @kevin for his support 🙌 It's time to highlight the new release features that we've made: - The auto calculation bar - a true killer feature. Select multiple cells on the grid to see it in action. 👆 - Integration with TypeScript & Vue.js - Working with modules dependencies is much more seamless now - More UI enhancements: create calculated fields more quickly & connect to remote JSON data from the Toolbar - More localization options 🌎 You are welcome to try the demo. And enjoy seamless reporting experience ✏️📝 https://www.webdatarocks.com/dem... 👈
Alex Clever
Oh! Completely free? it's great news! This tool is very helpful.
Antonina Krus
Thank you @axclever! Truly hope you will find it useful for your projects!
Lakshmanan Raman
The UX looks very simple and clean but I always had this question on why such analytics products never had a colorful UI to play with! V2 guys?
Iryna Kulchytska
Thank you @lakshmanan_raman for your comment! It's great that you consider the UI simple and clean. I'm not sure why the analytics products never have a colorful UI to play with :) That could be fun! Probably we would have gone this way if we were introducing an end-user product. But since WebDataRocks is a component, we made its UI easily adaptable to the UI of the applications it is embedded into. WebDataRocks can become a native part in terms of look and feel of any product where the analytics tool is needed: - It is fully customizable using API and CSS. - It comes with several built-in themes and new ones can be easily created using Less.
stas stepaniuk
Hi makers of !WebDataRocks! Thanks for sharing your product! I'd like to note that the interface is comfy - it seems that it has everything you need for data analysis. As an Angular developer, I know how challenging it can be to integrate the third-party library into an app. And I was pleasantly surprised by the ease of the component's integration and the fact that type definitions are available directly in the npm module. I'll definitely take a closer look at its API reference - it seems to be well-documented. By the way, dashboards with the pivot and charts are pretty awesome! Keep up the good work!
Antonina Krus
@stas_stepaniuk thanks a lot for your kind words😻! We are happy to hear that you enjoy your experience with our tool!
Veronika Rovnik
@stas_stepaniuk Thank you! Feel free to contact us in case of any questions :)
Rahul Viswakarma
This actually makes life more easier for data calculation and interpretation.
Veronika Rovnik
@rahul_viswakarma Hi Rahul, We're happy to hear that! :)
12
Next
Last