

This is the 10th launch from Tableau. View more

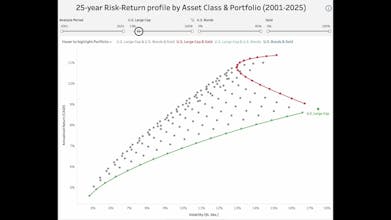
25Y Asset/Portfolio Risk-Return Profile
Launching today
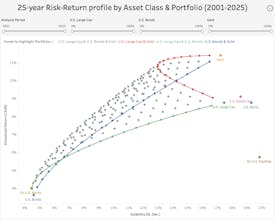
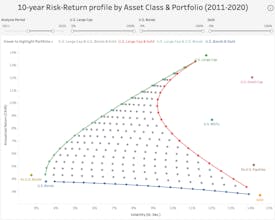
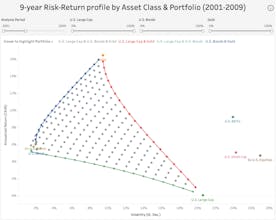
Lines represent portfolios consisting of two asset classes. Gray dots represent portfolios consisting of three asset classes with a 5% increment. Asset classes are highlighted with diamonds:
Hovering over a dot or diamond allows you to estimate the Annual Total Return for the selected period. You can filter by period and major asset classes.
The dashboard is not designed to find “perfect portfolios,” as the position of portfolios on the risk-return plane will change in the future.
Free
Launch Team


Tableau
Adding a second or third asset class to a portfolio at least reduces portfolio volatility, and if there is a negative correlation between assets, it also increases returns. It’s important to regularly rebalance between asset classes within the portfolio to maintain its target risk/return characteristics.