
Stockoscope
Analyze 3,000+ US stocks across five dimensions
9 followers
Analyze 3,000+ US stocks across five dimensions
9 followers
Stockoscope analyzes 3,000+ US stocks across five dimensions: Quality, Peers, Valuation, Analyst Sentiment, and Holdings. What's different: it shows its work. Every score reveals how it was built, and you set the weights, adjust the valuation assumptions, and build your own Quality, Value, and Dividend strategies. Screen the whole market visually with 40+ filters and 17 preset screens, then go deep on any stock. Free to start, no card, then Pro at $15/mo. A research tool, not advice.




Hi everyone, Nav here, the maker.
I spent about two decades as a veterinary epidemiologist, working with disease-surveillance data. The job teaches you one habit above all others: no single test is ever conclusive, so you triangulate. You line up several independent, imperfect signals and watch where they agree and where they fight. The picture that survives that cross-check is the one you trust.
A few years ago I started applying the same habit to my own investing, and I could not find a tool that worked the way I think. Most either hand you a single score with no way to see inside it, or bury you in raw data with no structure. So I built Stockoscope.
It looks at every stock through five dimensions: Quality, Peers, Valuation, Analyst Sentiment, and Holdings. The point is never any one score, it is how they line up. A cheap stock that is also low quality and being sold by insiders is a very different story from a cheap stock that is high quality and being bought.
The part I am most proud of: you set the weights. The defaults are a starting point, not a recommendation. You can re-weight the quality pillars, move every filter, change the valuation assumptions, and build your own Quality, Value, and Dividend strategies. You can also screen the whole market visually and then go deep on any name. Every score shows its work, so you can see why it landed where it did, and then disagree with it.
Honest limitations. It is US only for now, the S&P 1500 plus Russell 3000, more than 3,000 stocks. I cut international to get the data quality right rather than spread thin, and I would rather cover one universe well than five badly. And to be clear, this is a research tool, not advice. Everything it surfaces is a candidate for your own work.
On pricing: there is a free plan that stays free, no card, with three full 5D deep-dives a month plus unlimited company news and the simple screener. Pro is one plan, $15/mo or $150/yr, and every account starts with a free Pro trial so you can try everything first. If you start an annual plan before August 31 there is a Founding rate, $99/yr locked for three years. I would genuinely love your feedback, especially the critical kind. Ask me anything.
Love the transparency on how each score is built, that's a huge trust factor. One thing I'd love to see is a "compare side by side" mode where you can stack two or three stocks and see exactly which inputs are driving the score differences, kind of like a diff view. Would make it way easier to decide between similar names without flipping back and forth.
@remziavcu54671
Thank you, that means a lot. Transparency is the whole reason I built it this way, so it's great to hear it lands.
I really like the side by side idea. The closest thing today is the Peers Comparison page, which stacks a selected stock against its sector and industry peers across 40 metrics, but it isn't the direct two or three way comparison you're describing. That's something we can definitely build, and the most natural path would be to let you pick the specific stocks to line up right there in the peer comparison view.
Thanks for taking the time to write this up, and for the kind words. Constructive feedback like this is exactly what helps shape where it goes next.
How granular does the weight adjustment get on each dimension, like can I zero out analyst sentiment entirely or am I always locked into some minimum across all five?
@zafer173643 It's pretty granular. Each dimension breaks down into its own components, and you can exclude or reweight any of them. Quality, for example, is built from 10 pillars (cash flow, margins, returns, etc), and you can drop any pillar or change its weight.
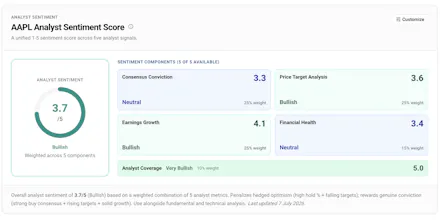
The Analyst dimension is based on five components, and you can exclude or reweight any of them.
The one thing we deliberately don't do is combine the five dimensions into a single overall score. We don't blend Quality, Peers, Valuation, Analysts, and Holdings into one number. All five are presented side by side, so there's no need to zero out a dimension like Analysts. You just read it alongside the others and weigh it however you see fit.
Thank you for your interest, and I'm happy to provide any further information.
@zafer173643
Here's our analyst sentiment score for example with customizable sliders
How customizable are the weighting really, like can I zero out one dimension entirely or does it always have to sum to 100 percent?
@necatipisk53626 Yes, you can zero out or exclude components entirely. In the screenshot below (our Quality investment strategy), two pillars, valuation multiples and dividend, are excluded, and the remaining pillars carry different weights that you can change freely.
One nice touch: you don't have to manually keep everything summing to 100 per cent. When you adjust one weight, it automatically accounts for the others, so you can focus on the pillar you care about.