So easy to use, highly customisable and a great way to track all the stats you want, especially those you won't / can't get anywhere else, and don't worry about making a mistake. It's fully editable after the event.
One other thing to add is the developers response and openness to improvement suggestions. I suggested some adjustments and they were made within hours, even received feedback emails. Amazing service provided.



@thejobelabs Congrats on the launch! I really like the 'progress, not pressure' approach here. For kids who aren’t scoring every game, a lot of the good work they do just disappears from the normal stats.
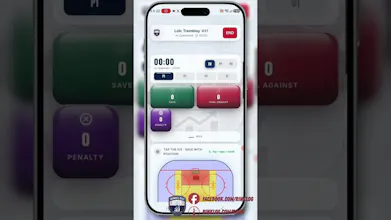
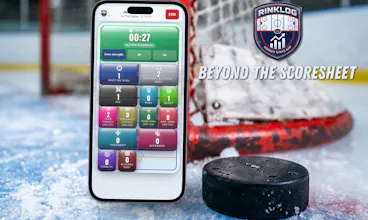
The one-tap tracking feels like the most important part to get right though, especially when a parent is actually trying to watch the game at the same time.
Also interested in the AI report card. Does it focus more on what improved since previous games, rather than just summarising the latest stats?
@josh_bennett1 Thanks!!! you picked out the exact thing I wanted. On the one-tap flow: that was the constraint everything else bent around. You're standing, it's cold, the play is moving, and you get about a second. So the board is built from buttons you choose yourself before the season. A defenseman's parent might set blocked shots, on-ice goals against, + & - stats, and nothing else. No menus, no drilling down. The test I kept coming back to:
can I log this without taking my eyes off the ice for more than a beat?
On the report card: yes, progression. And it's role-aware, which turned out to matter more than I expected. When you create a player you set their handedness and their type: sniper,
playmaker, two-way forward, defensive defenseman, offensive defenseman, and so on. The report reads the season through that lens. A defensive defenseman doesn't get judged on goals, he gets read on what his job actually consists of. We built that logic from coaching material and development literature rather than just handing a pile of stats to a model and asking for a summary.
Each monthly card shows what moved, shots per game, ice time, whatever actually changed and it's written to lead with what improved, even when there's a lot to work on. The "work on" part never gets left hanging either: it comes paired with concrete suggestions, physical work, on-ice drills, puck handling.
Monthly rather than after every game, on purpose. One game is not enough...
The whole thing comes out of an argument I made here, if you're curious:
https://rinklog.com/en/progression
https://medium.com/@thejobelabs/hockey-is-the-only-sport-that-forgets-its-own-players-ddab22f6e8c1
Appreciate you actually reading it.
@thejobelabs I like that this gives parents something more meaningful to look back on than just goals and assists.
Over a few months, seeing things like defensive work, battles won and consistency could actually show progress that would otherwise be easy to miss.
@xavair Thanks Xavair. It came out of my own years in the stands, and out of watching other parents try to do the same thing in a notebook or not app and give up by November. But the part I care most about is that it's the player's book, not the parent's. A kid can keep their own log and never show it to anyone, no team,
no coach, no group chat, no comparison with the kid next to them. They open it, they see what's going well and what they'd like to work on, and that's the end of it.
The moment a stat becomes something you have to show someone, it turns into pressure. That's the exact thing I was trying to get away from. And it only works across a stretch of games. You can't judge anything from 1 or 2 that's just how a kid ends up feeling bad about a Saturday. Over 5 - 10 you start seeing the real trend, and that's where a kid finds out he's been getting better at something nobody was writing down.
Five weeks between shipping the app and launching here
RinkLog went live on the App Store and Google Play on July 31. I waited a month before launching here, because I wanted real parents using it first. Here is what those five weeks actually looked like.
WHAT I SHIPPED
A calendar. This was the big one, and it came from being wrong. I built a statistics app and launched it in August, when there is no hockey. Parents signed up, opened it, and found nothing to record. So RinkLog now holds the whole season around the games: camps, tryouts, practices, tournaments, skate sharpenings, appointments. Ten event types, a month view and an agenda view, per-event reminders. If your league publishes an iCal feed you plug it in and the calendar fills itself. It syncs with Google Calendar, and it publishes its own .ics feed so it lands wherever you already live.
Off-ice training programs. Three of them: Stance, Speed, Shooting. Each runs over three days, A, B and C, that the kid checks off. Every completed session writes itself into the calendar, so by the first puck drop there is already a record of the work done.
Tournaments, and a guides section, because half my support emails were the same three questions.
WHAT I GOT WRONG
Three things, and the third one still stings.
I measured activation cumulatively. My funnel added a July signup who had six weeks of hockey to a signup from yesterday who has not had a single game yet. That number drops every time an ad brings people in. It is a metric that gets worse when things go well. I rebuilt it by cohort: take the people who signed up eight to fourteen days ago, so every one of them has had at least a week, and ask how many logged a game.
I counted a game as "opened a match screen". A parent who taps into a match out of curiosity and closes it ten seconds later is not an activated user, and counting them meant my dashboard was greenest about exactly the people I most needed to reach. A game now counts only if it ended, was entered as a stat sheet, or carries at least one event.
And I set my founding-price deadline for September 30. Minor hockey regular season in most leagues starts October 2. I built a deadline that expires two days before my product becomes useful to most of the people I was asking to pay. I found that out this week, from a calendar, not from my analytics.
THE PRINCIPLE
Progress, not pressure. It is not a slogan, it decided real things.
You can log from the bench instead of during play, so you are watching the game and not your phone. You can turn shift tracking off entirely and keep three buttons: goal, assist, shot on goal. You can correct a game's totals afterwards. The free plan does not expire and does not shrink. There is no leaderboard between kids, and there never will be.
THE STACK
Cloudflare Workers and D1, React, Capacitor for iOS and Android, bilingual French and English from the first commit. One person, which is why the calendar took three days and the App Store took five rejection rounds.
WHAT I WOULD LOVE FEEDBACK ON
1. The calendar bet. Is holding the whole season around the games the right move for a stats app, or did I just build a second product nobody asked for?
2. The wall. The free plan keeps the last three games, so the paywall arrives at game four, not on a date. Fair, or too soon?
3. The AI report card tone. It is written for a kid to read. I have rewritten it more times than anything else in the app and I am still not sure.
Happy to answer anything, including the numbers.
Someone asked about the numbers, so here they are.
269 accounts. 18 paying subscriptions.
That second number looks bad until you put it beside the third one: of the 38 people who have actually reached the paywall, 17 subscribed. That is 50%, and they paid before the season even started.
So my problem is not the price and not the product. It is that almost nobody has reached the paywall yet, because you cannot log hockey games in August. My whole funnel is waiting on a calendar I do not control.
That is the least glamorous lesson of the five weeks and the most useful one: before optimizing conversion, check whether your users are physically able to use the thing yet.