
LogStitch
Find AWS Lambda failures fast, right on your Mac
81 followers
Find AWS Lambda failures fast, right on your Mac
81 followers
Debugging a Lambda failure in CloudWatch is rough. Logs scattered across streams, no timeline, endless scrolling. LogStitch is a native Mac app that stitches your Lambda logs into one clear timeline. It clusters repeating error patterns and surfaces latency outliers, so you find the failure fast. It also ships a built-in MCP server, so AI assistants can query your Lambda logs directly and debug alongside you. One-time price, no subscription. 14-day free trial.


LogStitch
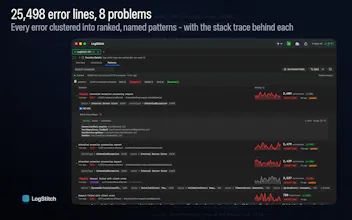
Lambda debugging in CloudWatch is genuinely terrible. You're juggling 4 browser tabs - one for each log stream, scrolling backward through timestamps trying to reconstruct what actually happened. The "one clear timeline" approach is exactly right. The error pattern clustering is the feature I didn't know I needed - often when a Lambda starts failing it's the same error repeating across 20 invocations and CloudWatch just shows you all 20 separately. Does it work with VPC-bound Lambdas where direct CloudWatch access is locked down, or does it need standard IAM permissions to the log groups?
LogStitch
@galdayan Thanks, and yeah, you nailed exactly why I built it. The 4-tabs-and-scrolling-backward thing is what broke me.
Good news on VPC: it works fine, nothing special needed. Even for a VPC-bound function, the logs get written by the Lambda service to CloudWatch Logs outside your VPC. LogStitch never touches your function or your VPC at all. It just reads from the regional CloudWatch Logs API from your machine, signed with your own credentials out of the macOS Keychain.
So all it needs is standard read access to the log groups. The full list is read-only and scoped to /aws/lambda/* (also listed in LogStitch Help Menu -> AWS Permissions Required):
logs:FilterLogEvents, logs:GetLogEvents, logs:DescribeLogStreams (the logs themselves + live tail)
lambda:ListFunctions, lambda:ListTags (function navigator)
cloudwatch:GetMetricStatistics (the metrics)
sts:GetCallerIdentity (connection test), plus sts:AssumeRole only if you use a role-based profile
The only real caveat is on your network. If your workstation can't reach the public AWS API endpoints at all (e.g. you only get to AWS through PrivateLink with no route out), that'd block it. For the normal case, VPC Lambda with regular creds on your laptop, it just works.
Oh yeah, that definitely resonates with me as a developer. Debugging Lambda in CloudWatch always falls apart the same way. Something breaks --> you hop between scattered log streams --> scroll forever trying to rebuild the timeline in your head. Of course it sucks. Having it all stitched into one readable timeline sounds like such a relief.
Quick q though - does the MCP server work with any AI assistant, or is it mainly tuned for Claude?
LogStitch
@oleg_tsizdyn Thanks for the feedback! Glad it lands.
On the MCP server itself: it's standard MCP, not tuned for Claude. It implements the spec straight up (JSON-RPC 2.0 over Streamable HTTP, with initialize / tools/list / tools/call and protocol version negotiation), and there's zero Claude-specific branching in the server. Any MCP-compatible client that can reach http://127.0.0.1:<port>/mc... work.
I'll be straight with you about one thing though: the in-app setup screen is written Claude-Code-first right now. The recommended path is a claude mcp add command and the config examples point at Claude's config files, because that's the client I use and test against every day. So if you're on a different MCP client, the server works fine, but you'll be translating those setup steps into your client's own config format rather than copy-pasting. Making that flow more client-neutral is on my list.
One real caveat that isn't about tuning: Claude Desktop specifically can't connect, because its connectors route through Anthropic's servers and can't reach a server running locally on your machine. Claude Code (CLI) and other clients that speak the standard HTTP transport directly are all fine.
For context, the server exposes 21 tools covering functions, invocations, errors, anomalies, cold starts, memory right-sizing, cost analysis, log search, correlation, and the error-pattern stuff, so an assistant can actually query your stitched timeline rather than just read raw logs.
LoadFast Snippet Expander
I like the constraint of focusing on Lambda failures specifically instead of trying to become a general observability dashboard. That usually makes the product much easier to reason about. Curious how much setup is needed before it can start surfacing useful failures.
LogStitch
@vidur_saini Yeah, that constraint is the whole thesis. I just focused on "what failed and why" to keep things focused and simple.
There's basically no setup in the instrumentation sense. No SDK, no agent to deploy, no log forwarding, no code changes to your functions. It reads your existing CloudWatch logs directly with read-only credentials, so nothing has to change on the AWS side.
The actual path from a fresh launch looks like this:
Connect your AWS account. If you've got a ~/.aws config it's basically one click to import your profiles, or you can paste keys / use SSO.
Open a function (it auto-lists your Lambdas) and fetch a time window.
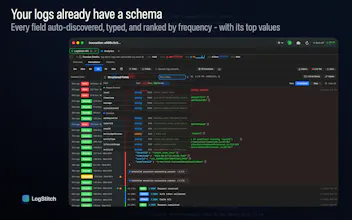
That's it for surfacing failures. The moment logs come in, errors, timeouts, and throttles are parsed out and flagged automatically in the invocation list. There are no rules, thresholds, or pattern definitions to configure first. It reads the status straight off the logs.
The error-pattern clustering is one more click: open the Patterns tab and run extraction. I keep that as a deliberate action rather than auto-running it on every fetch, but it's a single button and it runs in seconds for normal volumes.
If you don't want to keep hitting fetch, you can flip on background sync per function. It's off by default so the app isn't pulling logs behind your back, but once enabled it keeps pulling new invocations on an interval and new failures just show up on their own.
Does LogStitch work with any MCP-compatible AI assistant, or mainly Claude?
LogStitch
@rod_sodax It's standard MCP, so it's not Claude-only. The server just speaks the plain spec (JSON-RPC over Streamable HTTP) with no vendor-specific logic, so any MCP-compatible client that can hit the local endpoint works.
The one thing I'll flag: the in-app setup instructions are written for Claude Code right now, since that's what I build against. On another client the server runs fine, you'll just adapt those steps to your client's own config format. Making the setup more client-neutral is on my list for the next release.
Only hard limitation is Claude Desktop, and that's not about tuning. Its connectors route through Anthropic's servers, so they can't reach a server running locally on your machine. Claude Code (CLI) and other clients that connect directly over the standard transport are all fine.
The MCP integration caught my attention more than log stitching. Being able to ask questions directly against Lambda logs could change how developers investigate incidents if the responses stay accurate.
LogStitch
@advin_jadis Thanks, the MCP is honestly the part I'm most excited about too. Here's where I think it goes: point Claude Code at your repo and let it run in a loop, polling the Lambda logs through the LogStitch MCP for errors. When it sees one, it already has the real stack trace and surrounding context from the logs, ties that back to the code it has in front of it, reasons about the root cause, writes a fix, and opens a PR for your review.