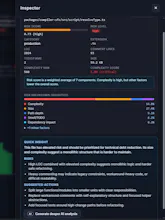
LegacyLens analyzes your GitHub repo and visualizes it as an isometric Code City — folders are districts, files are buildings.
Height = complexity, color = risk.
Click any building to open the Inspector: full metrics for that file plus AI analysis — what's risky, what might break, what to refactor first.
Supports Python, JavaScript, TypeScript, Vue.
Paste a GitHub URL; analysis takes ~20 seconds.
No reviews yetBe the first to leave a review for LegacyLens
Maker
📌
LegacyLens started from a frustration I kept running into while exploring large repositories.
Most code analysis tools give you metrics, static reports, or endless tables, but they rarely help you *see* where architectural risk actually lives.
I wanted something more visual and explainable.
So I started experimenting with the idea of turning repositories into an interactive “Code City”, where:
- folders become districts
- files become buildings
- height reflects size + complexity
- color reflects risk
Under the hood, the project combines AST-based analysis, weighted risk scoring, aggregated folder analytics, and optional AI-generated insights.
One of the hardest parts wasn’t parsing code — it was making the system understandable.
Balancing metrics, visualization, UX, and explainability together turned out to be much more difficult than I expected.
Another interesting challenge was scaling:
large repositories quickly become visual noise, so I had to introduce adaptive aggregation and logical grouping strategies for monorepos and high-volume projects.
The project is still evolving, and I’d genuinely love feedback, especially from engineers working with large or legacy codebases.