
Heaven — NEM Grid Intelligence
Curtail the hell, transmit the heaven
10 followers
Curtail the hell, transmit the heaven
10 followers
National Electricity Market real-time monitoring, digital twin, and BESS investment optimizer.
10 followers
10 followers





How does the digital twin handle sudden outages or unplanned events, and what data sources feed into the investment optimizer for BESS recommendations?
@arifevrec For the sudden outages, it models the NEM as a live graph with a bus admittance matrix. On a trip or failure, it zeroes out that line's admittance or the generator's output, then re-solves the dispatch (DC-OPF via HiGHS) across the remaining network. LMPs come straight from the Lagrange multipliers on the power balance constraint — so congestion from the outage shows up as an immediate, localized price spike.
and for the BESS, it combines live AEMO load/price/curtailment data, network contingency exposure, and weather forecasts (wind/solar) to jointly size power and energy capacity, factoring in round-trip efficiency and a 5-year degradation model.
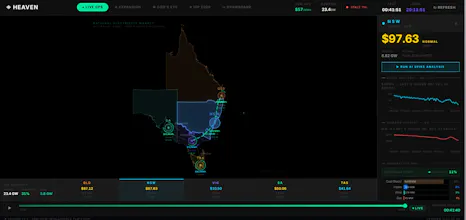
The digital twin visualization looks incredibly clean, especially the way the flow animations layer over the grid map without cluttering the data readouts. Whoever designed that balance between density and clarity clearly knows their audience.
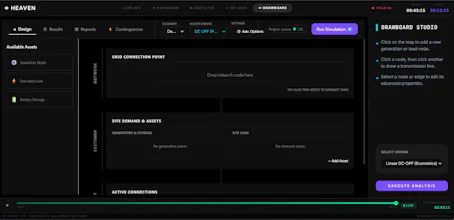
Finally something that actually shows the grid state in plain language instead of drowning you in jargon. The BESS optimizer tab was surprisingly practical for sizing a hypothetical battery.
the live NEM frequency view is genuinely useful for tracking battery dispatch windows, and the BESS optimiser surface area feels way more grounded than the usual market hype