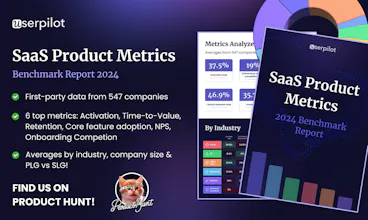
See how your product stacks up on metrics that matter. Explore exclusive first-party data gathered from 547 SaaS companies. Discover industry standards, expert analysis, and actionable tips to optimize your product's performance and drive revenue growth.
Dear Hunters - it took blood, sweat and tears to analyze the 547 companies we have in the SaaS Products Benchmarks report below so you can have the freshest, most accurate data sliced and diced by industry, company size, and PLG vs SLG. I know benchmark reports are often comparing apples to oranges - and yet they are essential to know how well you’re doing with your user engagement and product growth efforts. That’s why we wanted to make ours as granular as possible to be as useful as it gets. Packed with actionable insights on how to improve all the metrics - think folks like Marty Cagan or Dan Olsen - it will hopefully guide you towards better products, happier users and more revenue.
Let me know what you think!
@emilia_korczynska1 benchmarks are often hidden from other companies and other teams but really this is what every product person wants to know for their product. So crucial. Thank you
@emilia_korczynska1 love this! is the goal here just to lead capture and build the mailing list? Or is there a monetization play down the road. Either way you've got my email!
Report
Maker
Hey Hunters!
SaaS Product Benchmarks such as average User Activation Rate, Time to Value (Activation), Month 1 Retention Rate, or Core Feature Adoption Rate are hard to come by - and even harder to compare in a meaningful way.
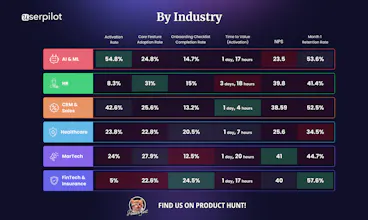
As a Product Analytics platform, we had the opportunity to collect anonymized first-party data from 547 SaaS companies on 6 product metrics directly from Userpilot’s Analytics Dashboards:
- User Activation Rate
- Time to Value (Activation)
- Month-1 Retention
- Core Feature Adoption Rate
- Onboarding Checklist Completion Rate
- NPS
The data was collected over the course of one year. The study contains not only the raw average and median numbers - but also the interpretation of the data, expert quotes, and actionable tips on how to improve your vital product metrics.
We're eager to hear your feedback and answer any questions.
I'm so excited to jump into this useful resource with so many rich insights. This is brilliant for all product people to delve into and I can't wait to see it presented live in Dublin this evening!
Report
Wow!
Thank you for the extensive research on SaaS structure of the current market.
I have currently glanced to all 90 pages and have already blocked to finish reading it today.
This stuff is amazing and every buddy entrepreneur in SaaS structure must read.
Thank you for reaching out and sharing this.
Good luck with the launch.
Happy to join any community or inner circle
Report
Finalyyy! From the scrappy gsheet to this polished version. So much work went into this to get all this data. Amazing insights. Great job team 🔥
Report
Crazy how SLG has a higher activation rate than PLG. Kudos to the team for diving deep into the data and for also including practical recommendations. Looking forward to the live event in Dublin!





Userpilot Surveys
Archbee
Userpilot Surveys
Scalenut
Outcome