Stimly models estimated caffeine levels over time. Inputs: drink logs, body profile, and a short calibration quiz. The system renders a live clearance curve, distinguishes slow sipping from fast intake, tracks tolerance trends, and shows estimated caffeine remaining at bedtime.
I used Turborepo and Next.js.
Stimly tracks caffeine and estimates how much is still active at bedtime. The clearance math lives in one pure-TypeScript package, @stimly/caffeine-engine, built on the Bateman model: absorption from the gut, then elimination. Both the Expo iOS app and the Next.js web app import it.
Turborepo is what made that workable for one person. The engine builds and tests first, and everything downstream rebuilds against it. When I change the curve, I change it once, and the phone and the browser cannot disagree about how much caffeine is left. For a bedtime estimate feature, having two apps show different numbers would kill trust.
Hi, I'm Mateusz, a solo developer from Poland.
I drink a lot of coffee and yerba mate, and the caffeine trackers I tried treated every cup like a light switch: one dose in, simple exponential decay out. That never sat right with me.
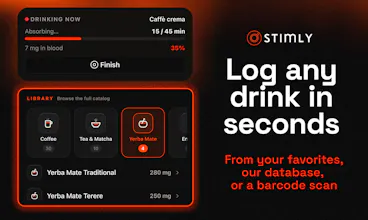
So I went down the rabbit hole and spent a lot of time reading absorption kinetics papers and prototyping models. The model I kept simulates caffeine moving from your gut into your bloodstream, and out again as your body clears it. It spreads each drink over the time you take to finish it (a Bateman infusion model), so a cold brew sipped over two hours rises slower and peaks later than an espresso finished in seconds. Lattes, energy drinks, and teas each get their own absorption profile too. Your personal half-life comes from a short quiz on how coffee affects you, adjusted for age and factors like smoking or hormonal contraception.
Still it's an estimate, not a lab test. But it's the closest I could get to what that 3 PM coffee is doing in our bodies.
A few things it does:
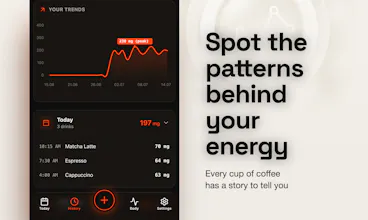
- Shows estimated caffeine levels now, the projected peak, and how much may remain at bedtime.
- Estimates baseline tolerance after three days of logging.
- Lets you log body signals like focus or jitters and see them on the curve.
Everything above is free. PRO adds 90-day history, tolerance trend charts, an expert brewing mode, and a 30-day PDF export.
If you track caffeine or care about sleep timing: does the curve line up with how you actually feel? I'm most interested in the days it doesn't ;)




Stimly
Stimly