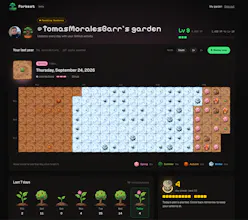
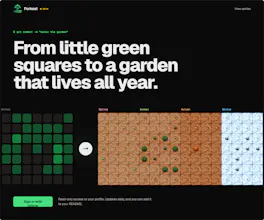
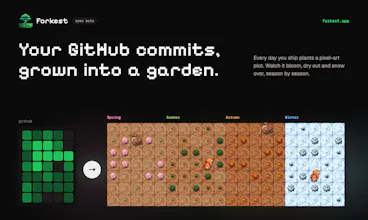
Forkest turns your GitHub contribution calendar into a pixel-art garden. Each day is a plot: no commits leaves bare soil, 8+ puts it in bloom. The garden changes with the seasons, from spring flowers to winter snow. Connect GitHub and it grows as you code.
I use Vercel to deploy Forkest and Vercel Analytics to understand how people use it.
As a solo developer, deploying on Vercel meant I could spend my time on the garden itself: the pixel art, the seasons and the GitHub integration, and not on servers. Every push to GitHub goes live, which fits well with a product about commits.
Vercel Analytics shows me where visitors come from and which pages they visit, without adding a heavy tracking setup. That helped me shape the landing and see what people look at before connecting their GitHub account.
Hi Product Hunt, I'm Tomas, the maker of Forkest.
I've always liked looking at my GitHub contribution graph, but after a while it's just green squares. I wanted it to feel more alive, like something that grows over time. So I built Forkest.
How it works:
Connect your GitHub account.
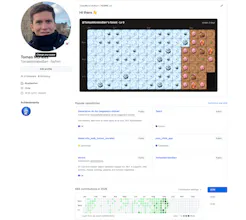
Each day on your contribution calendar becomes a plot in a pixel-art garden.
Days with no commits stay as soil. The more you commit, the more a plot grows, up to full bloom at 8+ commits.
The garden follows the seasons: it blooms in spring, grows through summer, dries out in autumn and snows over in winter.
This is my first launch here, and I built it on my own from Chile. I'd love to hear:
What would you want to see in your garden?
Would you share your garden on your profile or README?
Thanks for checking it out. I'll be here all day answering comments.


Forkest
Forkest