Ada.im

Ada.im

Your own AI data analyst

4.8
44 reviews

2.7K followers

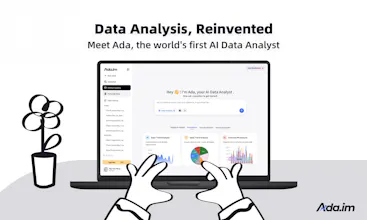
Ada.im is the world's first AI data analyst creating professional reports from any dataset. Automate data tasks, speed up analysis, and skip manual work in one click — no code or expertise needed. Effortless reporting for analysts and business pros.
This is the 2nd launch from Ada.im. View more
ChartGen AI

ChartGen AI

Launching today
Turn data into professional charts with insights in seconds
From the makers of Ada.im, ChartGen AI is an AI Chart Generator that transforms raw data into money-saving insights. It specifically empowers online marketers to connect all different data sources—from Facebook to TikTok—to generate instant visual charts. Stop guessing: see exactly where your budget goes so you can stop wasting your money. Whether you're optimizing ad spend or analyzing business trends, use ChartGen AI to convert your data into actionable graphics in seconds.
ChartGen AI gallery image
Free Options
Launch Team / Built With
AssemblyAI
AssemblyAI
Build voice AI apps with a single API
Promoted

What do you think? …

Steven Cen

Hi ProductHunt! 👋

I’m Steven Cen, the maker behind ChartGen AI.

Some of you might remember our previous launch, @Ada.im, which hit #1 Product of the Day and Week last September. While analyzing thousands of real users' feedbacks from that tool, we stumbled upon a fascinating pattern: non-technical users weren't just asking for text answers—they were desperate to see their data visualized.

As marketers, we all know the struggle: juggling CSVs from Facebook Ads, Google Analytics, Shopify, and TikTok, trying to piece together where our money is actually going. By the time we build the dashboard, the trend is already over. 🐢

That’s why we built ChartGen AI. We wanted to turn that "turtle-speed" manual reporting into an "owl-eyed" instant insight engine.

For all the online marketers here, this is specifically for you:

  • Unified Data View: Drag & drop your ad spend data from any channel.

  • Visualize the Journey: See exactly how every ad dollar converts across 30+ chart types tailored for marketing insights.

  • Actionable Insights: Don’t just look at numbers; understand which campaign needs more budget and which one to kill—in seconds, not hours.

We believe data should tell a story, not a headache. I’d love to hear your feedback on our visualization templates!


We are live and eager to hear what you think. Drop a comment below with your thoughts or questions! 🚀

Joey Zhang

The fact that ChartGen can generate a chart and provide insights in just minutes is incredible. It feels reliable, efficient, and it’s exactly the type of tool I’ve been looking for to streamline my data work.

Flávia Fu

This actually solves a real pain point for marketers. Nice work

Steven Cen

@flavia_fu Thanks! That is exactly the mission. 🚀 We built ChartGen.ai specifically to turn that marketing headache into instant clarity. Really appreciate you checking us out!

Charlene He

I’ve been using Ada.im for a while, and seeing it evolve into something like ChartGen is genuinely impressive. You can tell the team understands real data workflows, and this feels like a very natural next step!

Steven Cen

@charlene_he1 Thank you for the support, Charlene! 🙌 It’s amazing to have long-time users like you following our journey. We definitely see this as the natural evolution too—moving from text insights to full visual storytelling. Can’t wait to hear what you think of the new features!"


I really like how ChartGen lets you ask follow-up questions after creating a chart. It feels completely natural and allows me to further customize the chart to get deeper insights, rather than just having a static visual. It’s a nice feature that adds a lot of flexibility

Steven Cen

@djneverland Thanks! That’s exactly what we were aiming for. 🙌 Usually, customizing a chart means fighting with complex settings menus. We wanted to make it as natural as asking a colleague to "change the color" or "filter by last week." Thrilled to hear it feels natural to your workflow!

Vega

I decided to give ChartGen a test run by uploading a basic CSV file, and I was honestly blown away by how clean and accurate the bar chart came out. The output wasn’t just quick, it was really well-organized and visually appealing. Definitely exceeded my expectations for a quick tool!

Steven Cen

@vega_chan That is awesome to hear! 🤩 We believe that accuracy is just the baseline—charts need to look beautiful and professional enough to drop straight into a slide deck. We spent a lot of time fine-tuning the aesthetics, so I’m thrilled it exceeded your expectations! Thanks for taking the time to test run a CSV!"

YUKI KE

The follow-up questions ChartGen generates after creating a dashboard really surprised me. They helped me dive deeper into the data without having to think about what to ask next. It's almost like having a built-in consultant guiding you through your analysis. Very useful!

Steven Cen

@yuki1028 That is fantastic feedback, thank you! We designed those follow-up suggestions to act as a springboard for deeper analysis. It’s great to know they are helping you uncover value without the extra legwork. Thanks for sharing!

12
Next
Last