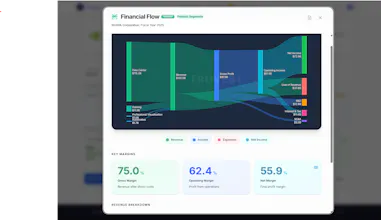
Wall Street research reports are 50+ pages of jargon. We break them into clear sections — profitability, debt, growth, valuation, peer comparisons — so you understand exactly where a stock stands and why. AI-powered, scored across 10 metrics, with every number compared to industry peers. Free to start.
Hey Product Hunt! 👋
We're three engineers who invest our own money in stocks. Not finance professionals — just DIY investors trying to make good decisions.
Here's what frustrated us: the research that Wall Street analysts produce is genuinely useful — but it's 50+ pages of jargon, buried in $25K Bloomberg terminals, and written for institutional fund managers. Retail investors get either raw data dumps (Yahoo Finance) or conflicting opinions (Seeking Alpha). Nothing in between.
So we asked: what if we could generate institutional-quality research but break it into sections that a normal person can actually understand?
That's Trovest. Search any US stock and get an AI research report broken into clear sections:
What each section tells you:
Profitability — Is this company actually making money? How do its margins compare to peers?
Financial Health — How much debt? Can they cover interest payments? What's the cash position vs. competitors?
Growth Outlook — Revenue and earnings trajectory, compared to industry averages
Revenue Quality — Is growth coming from real business or one-time items?
Management Alignment — Are insiders buying or selling? How does compensation compare?
Valuation — Is the stock cheap or expensive relative to its fundamentals and peers?
...and more across 16+ sections
Every metric is scored 0-10 AND compared to industry peers — so you're not just seeing that a company has 15% margins, you're seeing that 15% is below the sector average of 22%.
The "aha moment" for most users is the radar chart. It makes weak spots impossible to miss. A stock can look great on average but have one critical flaw that a wall of numbers would hide.
Our "no weak points" filter: Stocks need a 7.0+ overall score AND no single metric below 4.0 to make our Compelling Ideas list. High average + one fatal flaw = rejected.
Why we built it this way:
We realized the problem isn't that good analysis doesn't exist — it's that it's either unreadable, unaffordable, or full of conflicting opinions. We wanted one place where you search a ticker and immediately understand: what's strong, what's weak, and how it compares to peers. In sections you can read in 5 minutes, not 5 hours.
Free: 10 analyses/month with full scoring
Premium: $150/year for unlimited + full AI reports
Try it with a stock you own — the peer comparisons in each section are usually the eye-opener.
→ trovest.io
Report
No reviews yetBe the first to leave a review for Trovest