Launching today

Topophany
A terminal network topology & path observability tool
2 followers
A terminal network topology & path observability tool
2 followers
Self-hosted network monitoring in the terminal: a live map of your machines, paths and services, checked from the places you connect from, with the evidence behind every state. One Go binary. Try the live web demo (https://topophany.com/demo), powered by Go WebAssembly, which provides the exact same experience as running `topo preview` in your terminal.

Free
Launch Team

Customer.ioAutomate Messaging Everywhere — Startups Get 12 Months Free
Promoted
Hey Product Hunt community! 👋
I’m the maker of Topophany, and I’m super excited to share it with you all today.
💡 Why I built Topophany
If you manage multi-region VPSs, proxy chains, home labs, or distributed microservices, you’ve probably experienced this frustration: a monitoring dashboard turns red and says "Server X is unreachable."
But is the server actually down? Or is it just the routing path from your home connection that failed while the rest of the world sees it fine? What was the actual evidence?
Most existing observability stacks (Prometheus + Grafana, commercial APMs) are heavy, require Docker, databases, or Node.js frontends, and often boil down to simple "green vs. red" dials without route context.
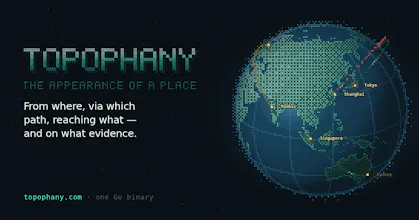
I wanted something fundamentally different: a lightweight, terminal-native tool that answers: From where, via which path, reaching what — and on what evidence.
✨ What makes Topophany unique:
• Pure Go, Zero Dependencies: Built entirely with Go’s standard library. Zero external modules, no CGO, no background database daemons, and no web frontend. Just a single static binary: topo.
• Evidence-Based Health: Health status, evidence origin, and freshness are distinct fields. A failure seen from Seattle while Tokyo is healthy is reported as a path anomaly from Seattle, not a server crash.
• Geeky Terminal Visuals: Features interactive Braille dot-matrix world maps, topological schematic routes, and mouse/keyboard navigation directly in your terminal.
• Instant Hands-on Preview: No configuration needed to try it. Just run topo preview, press x to simulate network outage scenarios, and inspect the lit-up failure paths.
🚀 100% Free & Open Source
Topophany is completely open source under the MIT license on GitHub https://github.com/WhitenWhiten/....
──────
I’d love to hear your feedback!
• How do you currently monitor your network paths and homelabs?
• What terminal features, protocols, or export formats would you like to see next?
I'll be hanging around the comments all day to chat, answer questions, and listen to your ideas. Thank you so much for your support! 🙌