Stockstack 0.5.0

Stockstack 0.5.0

Financial data aggregation made easy.

0 followers

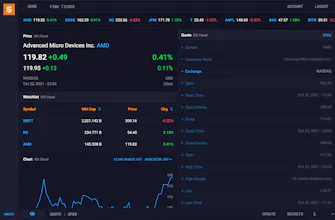
Browse financial data using your own API keys (IEX Cloud, YH Finance, Marketstack, etc.). Currently works best with IEX Cloud (subscribed to separately), but working on adding additional data providers and other APIs (such as notifications, filings, news).
Stockstack 0.5.0 gallery image
Free Options
Launch tags:ProductivityFintech
Launch Team
Flowstep
Flowstep
Generate real UI in seconds
Promoted

What do you think? …

Michael Sjöberg
Hello All, I have made several attempts to build apps to improve my own workflow (equity research), first to move portfolio management tasks from spreadsheets to web (Modelmode.io, then EQZEN.com, both discontinued and reverted back to spreadsheets), then data aggregation tasks (an attempt to solve some issues I had with Yahoo Finance and alternatives to Yahoo Finance). Stockstack is the most recent attempt and started as a solution to view financial data on desktop (not in browser, similar to a terminal), using data provided by IEX Cloud, and basically added features and additional data when needed. I then started to use an early version of this desktop-app for almost all data needs (only went to Yahoo Finance for data not yet implemented). It was initially designed to provide me with the data I most commonly want in a single view (no clicking around), but later transformed into providing any (available) data I want in the view (based on customizable templates). The current state of Stockstack (beta): - Data availability depends on provided API key (subscribed to separately). Pricing not based on data. - Modular and customizable interface (hide/show and move widgets, hide/show data in widget). Next steps: - Support for additional data providers (currently only IEX Cloud and working on adding Yahoo Finance via Rapid API). This improves amount of useful data available to users. - Change style and format of data, and create new data. This improves usability and gives users more tools for customization.