Soon, more agents than humans will use your product via MCP. Spanly gives you full observability on the MCP server you ship: error rates, session traces, latency, client analytics, deploy alerts. Drop-in CLI or SDK. US & EU data residency. Built for SaaS engineering teams shipping MCP in production, alongside the Datadog, Sentry, or New Relic you already run.
Hi!
I'm Tim, solo founder of Spanly.
Since MCP got traction in early 2025, I've been convinced that within a few years, agents may use your product more than humans do, and if so, they'll likely do it via MCP.
Today, MCP monitoring often stops at the HTTP layer, and at best instruments the official SDK to gather a few more insights. You still can't observe any deployed MCP, get the overall view, the sessions, or the analytics. Spanly is my attempt to fill that gap!
The key concept: capture every JSON-RPC request and response your MCP server handles. Put the Spanly CLI in front of any MCP server (or use the TypeScript/Python SDK) and get a live, organized view of all that traffic.
- Error rates and p50/p95/p99 latency per tool, resource, prompt, etc...
- Per-client, per-server, per-version views
- Full session traces to replay what an agent did, with payload
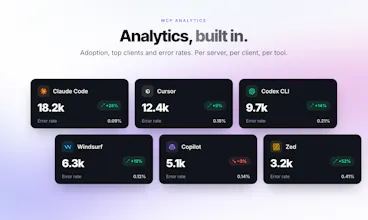
- Adoption analytics, with a Product view for PMs next to the Engineering view
- Alerts when a deploy spikes errors
- Data stored in the US or in the EU
The CLI and SDKs are open source (Apache 2.0). The cloud is paid: free up to 100k requests per month, plans from $49 with graduated volume pricing. Enterprise features (SSO, audit logs) on higher tiers.
Would love your feedback!
Report
This is timely. I ship an MCP server, and my blind spot is tool-level, not transport. I want to see which tools agents actually reach for versus the ones I built that never get touched, plus the shape of the arguments they pass, because that would change what I cut and what I harden far more than p95 would. Are you capturing per-tool call analytics and argument patterns, or mostly session traces and latency right now?



Spanly
This is timely. I ship an MCP server, and my blind spot is tool-level, not transport. I want to see which tools agents actually reach for versus the ones I built that never get touched, plus the shape of the arguments they pass, because that would change what I cut and what I harden far more than p95 would. Are you capturing per-tool call analytics and argument patterns, or mostly session traces and latency right now?
Spanly
@hunter_upscale Hey Ahmed!
Spanly does rank tools by their number of requests, it also allows you to dig into each request and see the actual arguments and result.
Per tool call analytics: yes
Argument patterns: yes for inspection, no for generalized analytics
I love your insight for the argument "shape" analytics, will see how I can get that into the product in the coming weeks!
Thanks for the feedback, and let me know if you would have some other feature in mind that would help make your MCP better.