Launching today

Senzor
14 monitoring tools replaced by one unified platform
6 followers
14 monitoring tools replaced by one unified platform
6 followers
Most teams run 5-10 disconnected tools to monitor their stack. Senzor replaces all of them. One platform, 14 capabilities: Infrastructure monitoring, database observability, APM with distributed tracing, centralized log management, global error tracking, uptime monitoring, cookie-less web analytics, real user monitoring, background task tracking, Firebase auth monitoring, alerts & incident routing, custom dashboards, AI-powered analysis via MCP, and native OpenTelemetry ingestion.


Hey Product Hunt!
I'm Ashish, the maker behind Senzor.
The problem: Every engineering team I've worked with cobbles together a Frankenstein monitoring stack — Datadog for APM, Sentry for errors, UptimeRobot for pings, Google Analytics for traffic, Grafana for dashboards, some custom script for cron jobs, and nothing at all for database query latency or Firebase auth metrics. You end up paying for 8+ subscriptions and still have blind spots.
What Senzor actually covers (all 14, in one platform):
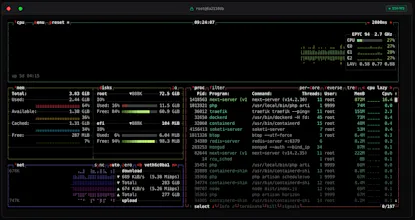
Infrastructure — CPU, memory, disk, network for every server/VPS
Database Observability — Query latency, connection pools, throughput (MongoDB, Redis, MySQL, PostgreSQL)
Firebase Monitoring — User growth, signups, MFA adoption, auth provider distribution
Web Analytics — Cookie-less, GDPR-compliant traffic tracking
Real User Monitoring — Core Web Vitals, network waterfalls, rage clicks
APM — Distributed tracing across micro-services via OpenTelemetry
Background Tasks — Queue depth, worker health, dead-letter detection
Error Tracking — Exception fingerprinting with full stack traces
Log Management — MQL query engine with live-tail streaming
Uptime Monitoring — Synthetic HTTP/TCP endpoint checks
MCP AI Server — Natural language querying over your telemetry via LLMs
Alerts & Incidents — Multi-condition policies routed to Slack, Email, Webhooks
Custom Dashboards — Drag-and-drop canvas with cross-service widgets
Native OpenTelemetry — Zero-config OTLP ingestion for Go, Java, Python, Rust
Why this exists: We were spending $500+/month on fragmented tools and still couldn't correlate a frontend error to a slow database query during an incident. Senzor was built to give you that full picture — from the browser click to the database query — in one tab.
Pricing: Free tier (2 GB/month), Pro at $29/month for 15 GB pooled across all services. No per-host pricing.
We'd love to hear: which of these 14 capabilities would save you the most headache if it just worked out of the box?