Launched this week
searchali.com

searchali.com

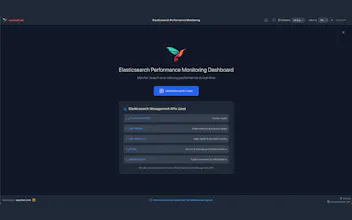
Monitoring Elasticsearch clusters from a Chrome extension

2 followers

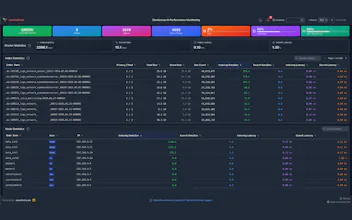
A Chrome extension that puts a real-time Elasticsearch indexing and search metrics in your browser. Multi-cluster support, instant switching, and metrics: indexing/search rates, latencies, CPU, JVM, disk. Interactive charts, index & node tables, and customizable alerts. No proxy—your browser talks directly to your cluster; your data stays with you. For devs and ops who want fast, visual monitoring without Kibana or the terminal.
searchali.com gallery image
Free
Launch Team / Built With
Wispr Flow: Dictation That Works Everywhere
Stop typing. Start speaking. 4x faster.
Promoted

What do you think? …

Musab Dogan
Maker
📌
> What inspired us: We kept jumping between Kibana and the terminal to check cluster health, indexing rate, and search latency. We wanted a single place in the browser that’s always one click away—especially when debugging or doing quick checks. > The problem we’re solving: Developers and ops need a fast way to see if a cluster is healthy, which nodes are under load, and how search/indexing are performing. Opening Kibana or running curl is often more than we need. We built this so you can add your cluster URL (and optional auth), open the extension, and get real-time metrics, charts, and index/node stats without leaving Chrome. > How it evolved: We started with a simple health + metrics view, then added multi-cluster support and drag-and-drop reordering. We added configurable alerts (cluster status, JVM heap, disk, CPU, slow search/indexing) so you can catch issues without constantly refreshing. Everything stays between your browser and your cluster—no backend, no data collection—so it stays simple and privacy-friendly.