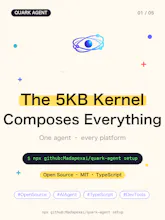
Quark Agent is an open-source TypeScript agent runtime built around a 5KB microkernel. It ships with 16 composable tools, 7 channel adapters (CLI, HTTP, Discord, Slack, Feishu, GitHub, Telegram), MoA model routing, sandbox policies, and self-evolution — with zero third-party SDK dependencies. MIT licensed.
No reviews yetBe the first to leave a review for Quark Agent
Maker
📌
Hey Product Hunt! 👋
I'm the maker of Quark Agent. I built it because I kept hitting the same wall: every agent framework I used started small, then swallowed my whole codebase. I wanted the opposite — a kernel so small you can read it in one sitting, where everything (tools, channels, models, protocols) is just a plugin.
So the core is 5KB: Agent + Provider + Memory + Sandbox. On top of that:
• 16 tools you compose with a single defineAction
• 7 channels out of the box — the same agent runs in your terminal, Slack, Discord, Feishu, Telegram, GitHub webhooks, or as an HTTP API
• MoA routing so cheap models handle easy tasks and strong models handle hard ones
• A sandbox policy layer so it's safe to let it run shell commands
• GEPA, which lets the agent evolve its own prompts over time
And zero third-party SDK dependencies — every provider talks over native fetch, so the install stays tiny.
It's MIT open source and already at v0.3 with an 89% benchmark pass rate. v0.4–v1.0 will bring npm publish, computer-use / browser-use, multi-agent orchestration, and an MCP marketplace.
I'd genuinely love your feedback — especially from anyone who's felt agent frameworks are too heavy. What would you build on a 5KB kernel?
Report
Having a built-in OpenTelemetry exporter alongside the sandbox policies would be huge, since debugging multi-step tool calls across Slack and GitHub right now feels like flying blind. Even a minimal span view for each MoA route would save a ton of time.
Report
Maker
@hakkbarutuoljv On the money. The tracer is already OTel-compatible in shape (spans carry traceId / spanId / kind / timestamps / attributes) and there's a Langfuse exporter today — but you're right that a native OpenTelemetry exporter (OTLP → Jaeger/Tempo) and per-route MoA spans are the gaps. The MoA router is implemented (MoARouter, complexity-scored fast/medium/powerful) and I'm wiring it into the default execution path; once live, a span per route (model + latency + cost) is a small, centralized addition. Combined with the existing tracer and sandbox-gated tool calls, that's exactly the Slack/GitHub visibility you described. Native OTLP export lands next to the Langfuse one — sampling controls or full traces by default?
Report
the 5KB microkernel thing is genuinely impressive, honestly love how lean it is. one thing i'd really want to see is a built-in observability layer, like structured traces for tool calls and channel hops. kind of hard to debug agent flows right now without bolting on your own logging setup, basically would make it way more approachable for folks shipping this in production
Report
Maker
@sebahattincorl Great point — and good news: there's already a built-in tracing layer. The kernel wraps agent.run, provider.chat, and every tool.execute in spans (latency, status, model, tool, args) via an InMemoryTracer, and it already exports to Langfuse out of the box with a trace viewer in the dashboard. What's NOT there yet is cost attribution (token usage isn't written into spans yet) and a raw span view for channel hops — both on my list. Since every tool call already passes through a scope-authorization interceptor, adding a trace hook needs zero changes to your code. What's your bigger pain — replaying a failed run, or live visibility while it executes?
Report
The microkernel size is honestly impressive, love that it's MIT too. One thing though — a visual flow builder for chaining tools and channels would be huge for non-devs who want to prototype without writing TypeScript first. Think something like a node-based canvas where you drag tools together and it exports the config. Basically n8n vibes but for your runtime. Would make onboarding way smoother.
Report
Maker
@cananim6v Love this — and it's further along than it might look. There's already a DAG execution engine (WorkflowEngine) in the core that runs typed nodes (llm / tool / condition / code / …) with positions kept for visualization, plus a web UI in the dashboard. The missing piece is the drag-to-author canvas, and that's on the near-term roadmap. Because the runtime is config-driven — an AgentConfig + tool profile describe an agent declaratively — a node canvas that compiles down to that config is very much in reach. Non-dev onboarding is exactly the goal. What would you build first with it — chaining tools into multi-step flows, or wiring channels into one agent?
Having a built-in OpenTelemetry exporter alongside the sandbox policies would be huge, since debugging multi-step tool calls across Slack and GitHub right now feels like flying blind. Even a minimal span view for each MoA route would save a ton of time.
@hakkbarutuoljv On the money. The tracer is already OTel-compatible in shape (spans carry traceId / spanId / kind / timestamps / attributes) and there's a Langfuse exporter today — but you're right that a native OpenTelemetry exporter (OTLP → Jaeger/Tempo) and per-route MoA spans are the gaps. The MoA router is implemented (MoARouter, complexity-scored fast/medium/powerful) and I'm wiring it into the default execution path; once live, a span per route (model + latency + cost) is a small, centralized addition. Combined with the existing tracer and sandbox-gated tool calls, that's exactly the Slack/GitHub visibility you described. Native OTLP export lands next to the Langfuse one — sampling controls or full traces by default?
the 5KB microkernel thing is genuinely impressive, honestly love how lean it is. one thing i'd really want to see is a built-in observability layer, like structured traces for tool calls and channel hops. kind of hard to debug agent flows right now without bolting on your own logging setup, basically would make it way more approachable for folks shipping this in production
@sebahattincorl Great point — and good news: there's already a built-in tracing layer. The kernel wraps agent.run, provider.chat, and every tool.execute in spans (latency, status, model, tool, args) via an InMemoryTracer, and it already exports to Langfuse out of the box with a trace viewer in the dashboard. What's NOT there yet is cost attribution (token usage isn't written into spans yet) and a raw span view for channel hops — both on my list. Since every tool call already passes through a scope-authorization interceptor, adding a trace hook needs zero changes to your code. What's your bigger pain — replaying a failed run, or live visibility while it executes?
The microkernel size is honestly impressive, love that it's MIT too. One thing though — a visual flow builder for chaining tools and channels would be huge for non-devs who want to prototype without writing TypeScript first. Think something like a node-based canvas where you drag tools together and it exports the config. Basically n8n vibes but for your runtime. Would make onboarding way smoother.
@cananim6v Love this — and it's further along than it might look. There's already a DAG execution engine (WorkflowEngine) in the core that runs typed nodes (llm / tool / condition / code / …) with positions kept for visualization, plus a web UI in the dashboard. The missing piece is the drag-to-author canvas, and that's on the near-term roadmap. Because the runtime is config-driven — an AgentConfig + tool profile describe an agent declaratively — a node canvas that compiles down to that config is very much in reach. Non-dev onboarding is exactly the goal. What would you build first with it — chaining tools into multi-step flows, or wiring channels into one agent?