
Opsion
Spring Boot monitoring without the stack
2 followers
Spring Boot monitoring without the stack
2 followers
Opsion helps Spring Boot and JVM teams monitor application health in real time. Track metrics, spot performance issues early, and respond to incidents before they affect users. With built-in dashboards and alerts, Opsion gives you useful visibility fast, without the overhead of running a complex observability stack.


Hey Product Hunt,
I’m Ziko, the solo founder behind Opsion.
Today I’m launching Opsion, a monitoring product built specifically for Spring Boot applications.
I started building it because I kept running into the same problem: getting useful monitoring often means assembling and maintaining a full stack before you get real value. Prometheus, Grafana, exporters, storage, alerting, dashboards — it works, but for a lot of smaller teams it is more effort than they want to own.
Opsion is my attempt to make that simpler.
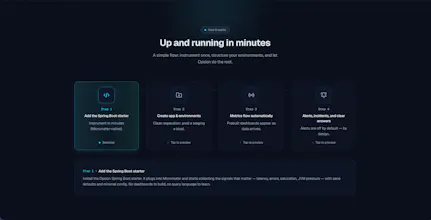
It gives Spring Boot teams a faster path to visibility, with built-in dashboards, alerts, and a more opinionated setup so you can get useful monitoring without all the usual stack overhead.
With Opsion, you get:
Fast setup for Spring Boot apps
Built-in dashboards
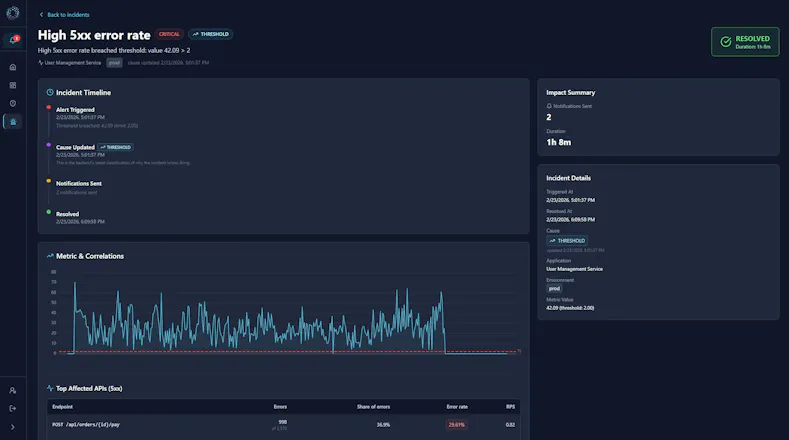
Alerts and incident visibility
Predictable pricing
Less operational overhead
A simpler path to useful monitoring
I built it for teams that want solid visibility into their apps, but do not want to spend their time stitching together and maintaining the monitoring stack themselves.
Opsion is now live, and I’d really love honest feedback:
Is the problem clear?
Does the positioning make sense?
What would stop you from trying it?
Happy to answer everything here 👇