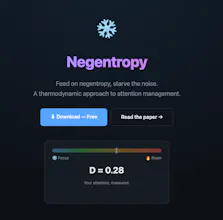
Negentropy measures the entropy of your digital attention in real time โ right in your browser. Most tools tell you HOW LONG you spent. Negentropy tells you HOW ENTROPIC your information environment was. Five information-theoretic metrics. Zero cloud. 100% local.
No reviews yetBe the first to leave a review for Negentropy v1.0
Maker
๐
Hi Product Hunt! ๐
I'm a physics researcher, and I built Negentropy because I kept falling into "unconscious wandering" โ opening YouTube "just for a minute" and losing an hour. The existing tools told me how long I spent on websites, but not whether my attention was ordered or chaotic.
So I applied information theory to the problem:
โ H_text: Shannon entropy of page content (information density) โ R: Information flow rate (how fast new content floods in) โ H_rate: Navigation transition entropy (how randomly you jump between sites) โ G: Goal relevance (is this page related to what you're supposed to be doing?) โ D: Distraction Index (composite score combining all of the above)
The idea comes from Schrรถdinger: "Life feeds on negative entropy." Your attention does too. Focus requires continuous injection of negentropy (goals, reminders, structure) to resist the natural drift toward entropy (distraction, noise, wandering).
Everything runs locally in your browser. No cloud, no tracking, no external API calls. Your entropy data never leaves your device.
I also wrote a paper on the methodology โ link in the landing page.
The extension is free and open source. Install instructions are on the site (load unpacked in Chrome developer mode).
I'd love your feedback โ especially on the entropy metrics. What would make this more useful for you?
Report
A small thing that would make this way more useful for me: a per-tab entropy breakdown so I can finally see which tabs are the chaotic ones instead of just the whole browser average. Bonus points if you could flag specific sites contributing the most noise.
Report
Maker
@melahat45588ย Thanks Melahat! Per-tab entropy breakdown is a great idea โ right now we compute at the browser level, but the architecture already tracks domain-level transitions. Surfacing per-tab scores and a "top noise contributors" list is going into the next version. Would you want it as a separate dashboard view, or inline on the floating overlay?
A small thing that would make this way more useful for me: a per-tab entropy breakdown so I can finally see which tabs are the chaotic ones instead of just the whole browser average. Bonus points if you could flag specific sites contributing the most noise.
@melahat45588ย Thanks Melahat! Per-tab entropy breakdown is a great idea โ right now we compute at the browser level, but the architecture already tracks domain-level transitions. Surfacing per-tab scores and a "top noise contributors" list is going into the next version. Would you want it as a separate dashboard view, or inline on the floating overlay?