
MarketFairValue
What's a stock actually worth? Find out free
5 followers
What's a stock actually worth? Find out free
5 followers
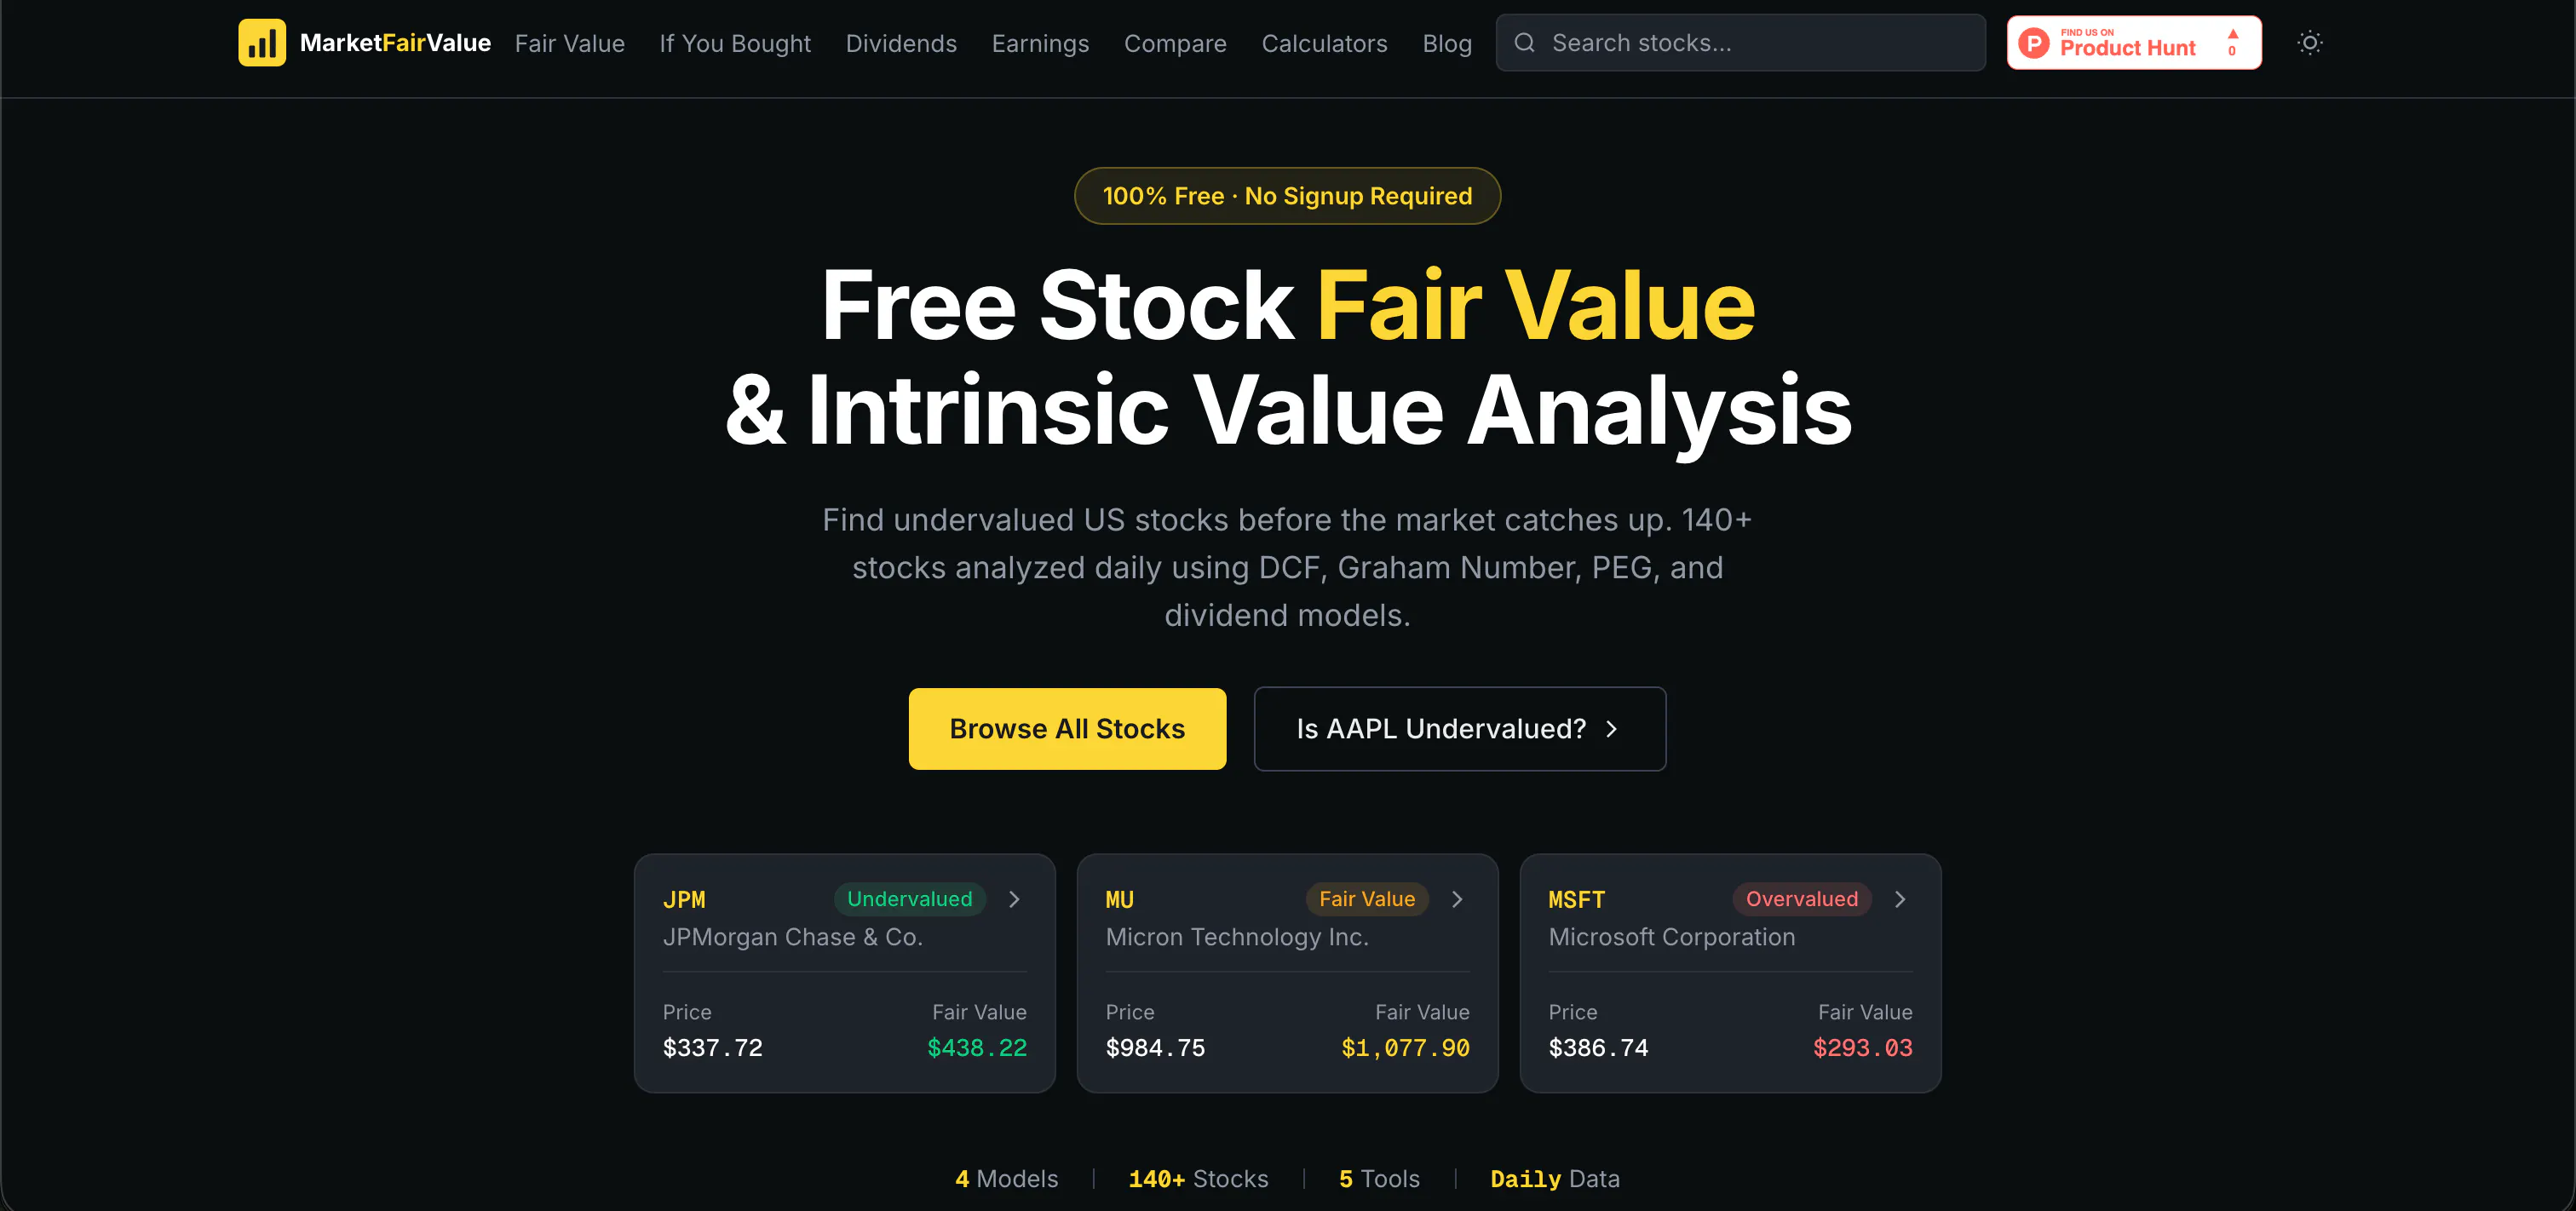
MarketFairValue analyses 140+ US stocks daily using four valuation models. DCF, Graham Number, PEG, and Dividend Discount - blended into one composite fair value. Each stock gets a clear Undervalued, Overvalued, or Fair Value verdict. Adjust assumptions with interactive sliders. Five built-in tools per stock: fair value, historical returns with DRIP, dividend income planner, earnings countdown, and benchmark comparisons vs S&P 500, Gold, and Bitcoin. 100% free, no signup required.




How often do you refresh the underlying inputs like cash flows and discount rates, and do users get to see which model is pulling the most weight in that composite fair value score?
@feyza1144590 Data refresh: All financial inputs (cash flows, earnings, growth rates, dividends, analyst estimates) are refreshed every 24 hours through an automated pipeline. So the fair values you see are always based on the latest available data.
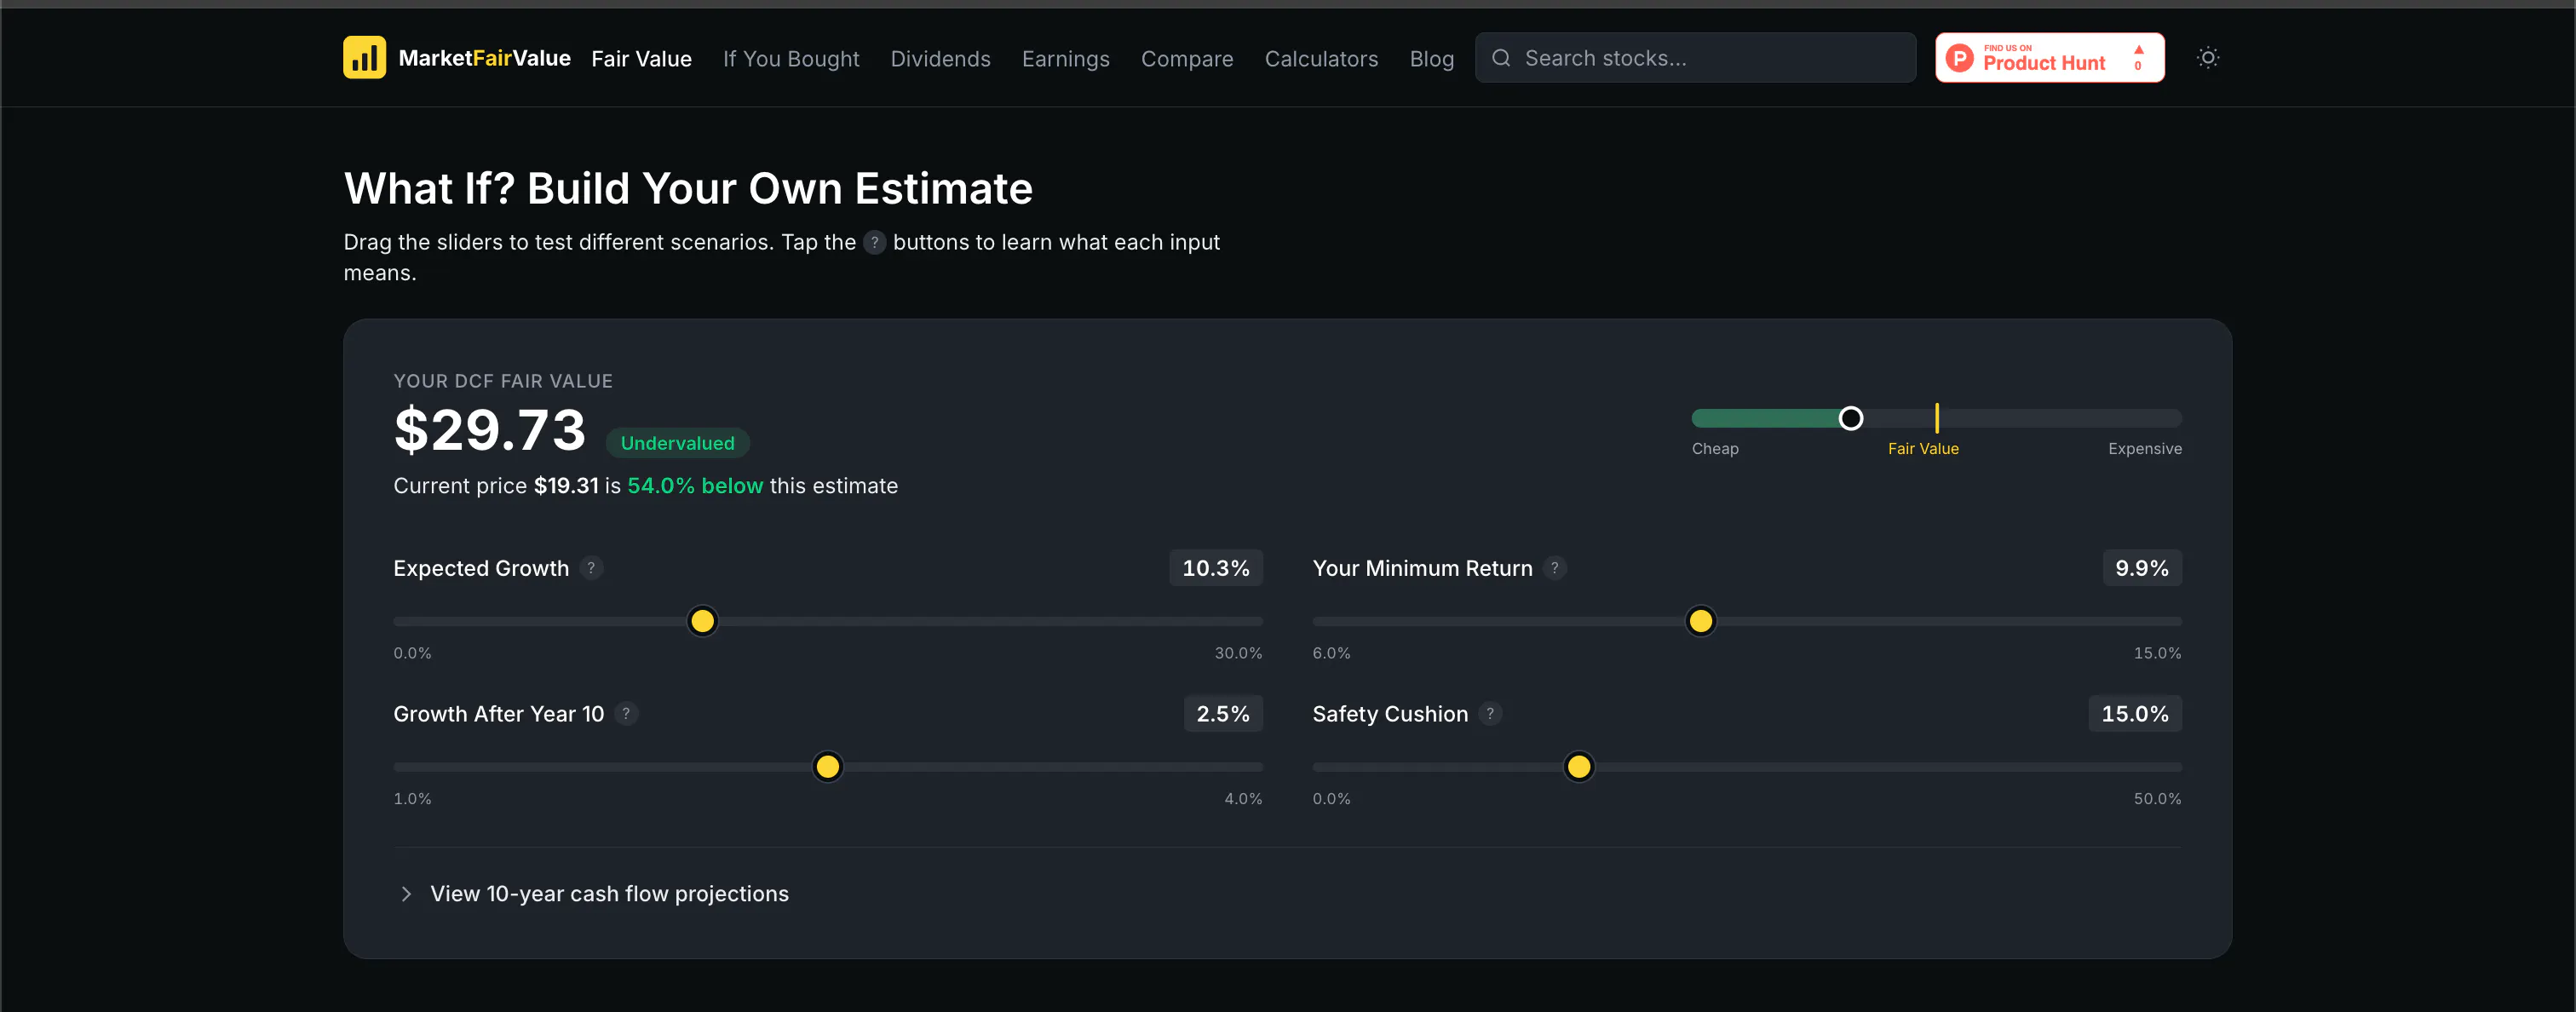
Discount rates: We use a 10% discount rate as the default, but on every stock page you can adjust it yourself using our interactive DCF sliders. Change the growth rate, discount rate, terminal growth, or margin of safety and watch the intrinsic value update in real-time.
Model transparency: Yes! Each stock page shows the individual estimate from all 4 models and how they combine into the composite verdict. We also have a full breakdown of the weights and rationale on our blog: https://marketfairvalue.com/blog/stock-valuation-methods-compared/
Nothing is hidden behind a black box. You see every input and every model's output.
Try it on any stock: https://marketfairvalue.com/stocks/
Hey Product Hunt!
I'm a software developer who invests on the side. Every time I wanted to check if a stock was overpriced or a bargain, I had two options: pay $30-$450/month for premium tools, or open a spreadsheet and run a DCF model manually. Again.
So I built what I wished existed.
MarketFairValue runs four valuation models (DCF, Graham Number, PEG, and Dividend Discount) and blends them into one composite fair value with a simple verdict: Undervalued, Overvalued, or Fair Value. Because no single model works for every stock.
The part I like most: interactive sliders let you tweak growth rate, discount rate, and margin of safety to see how the fair value changes. It's your assumptions, not just mine.
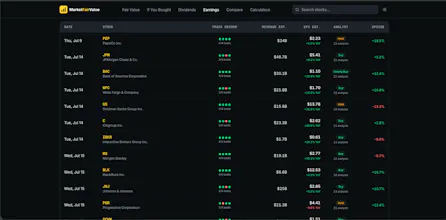
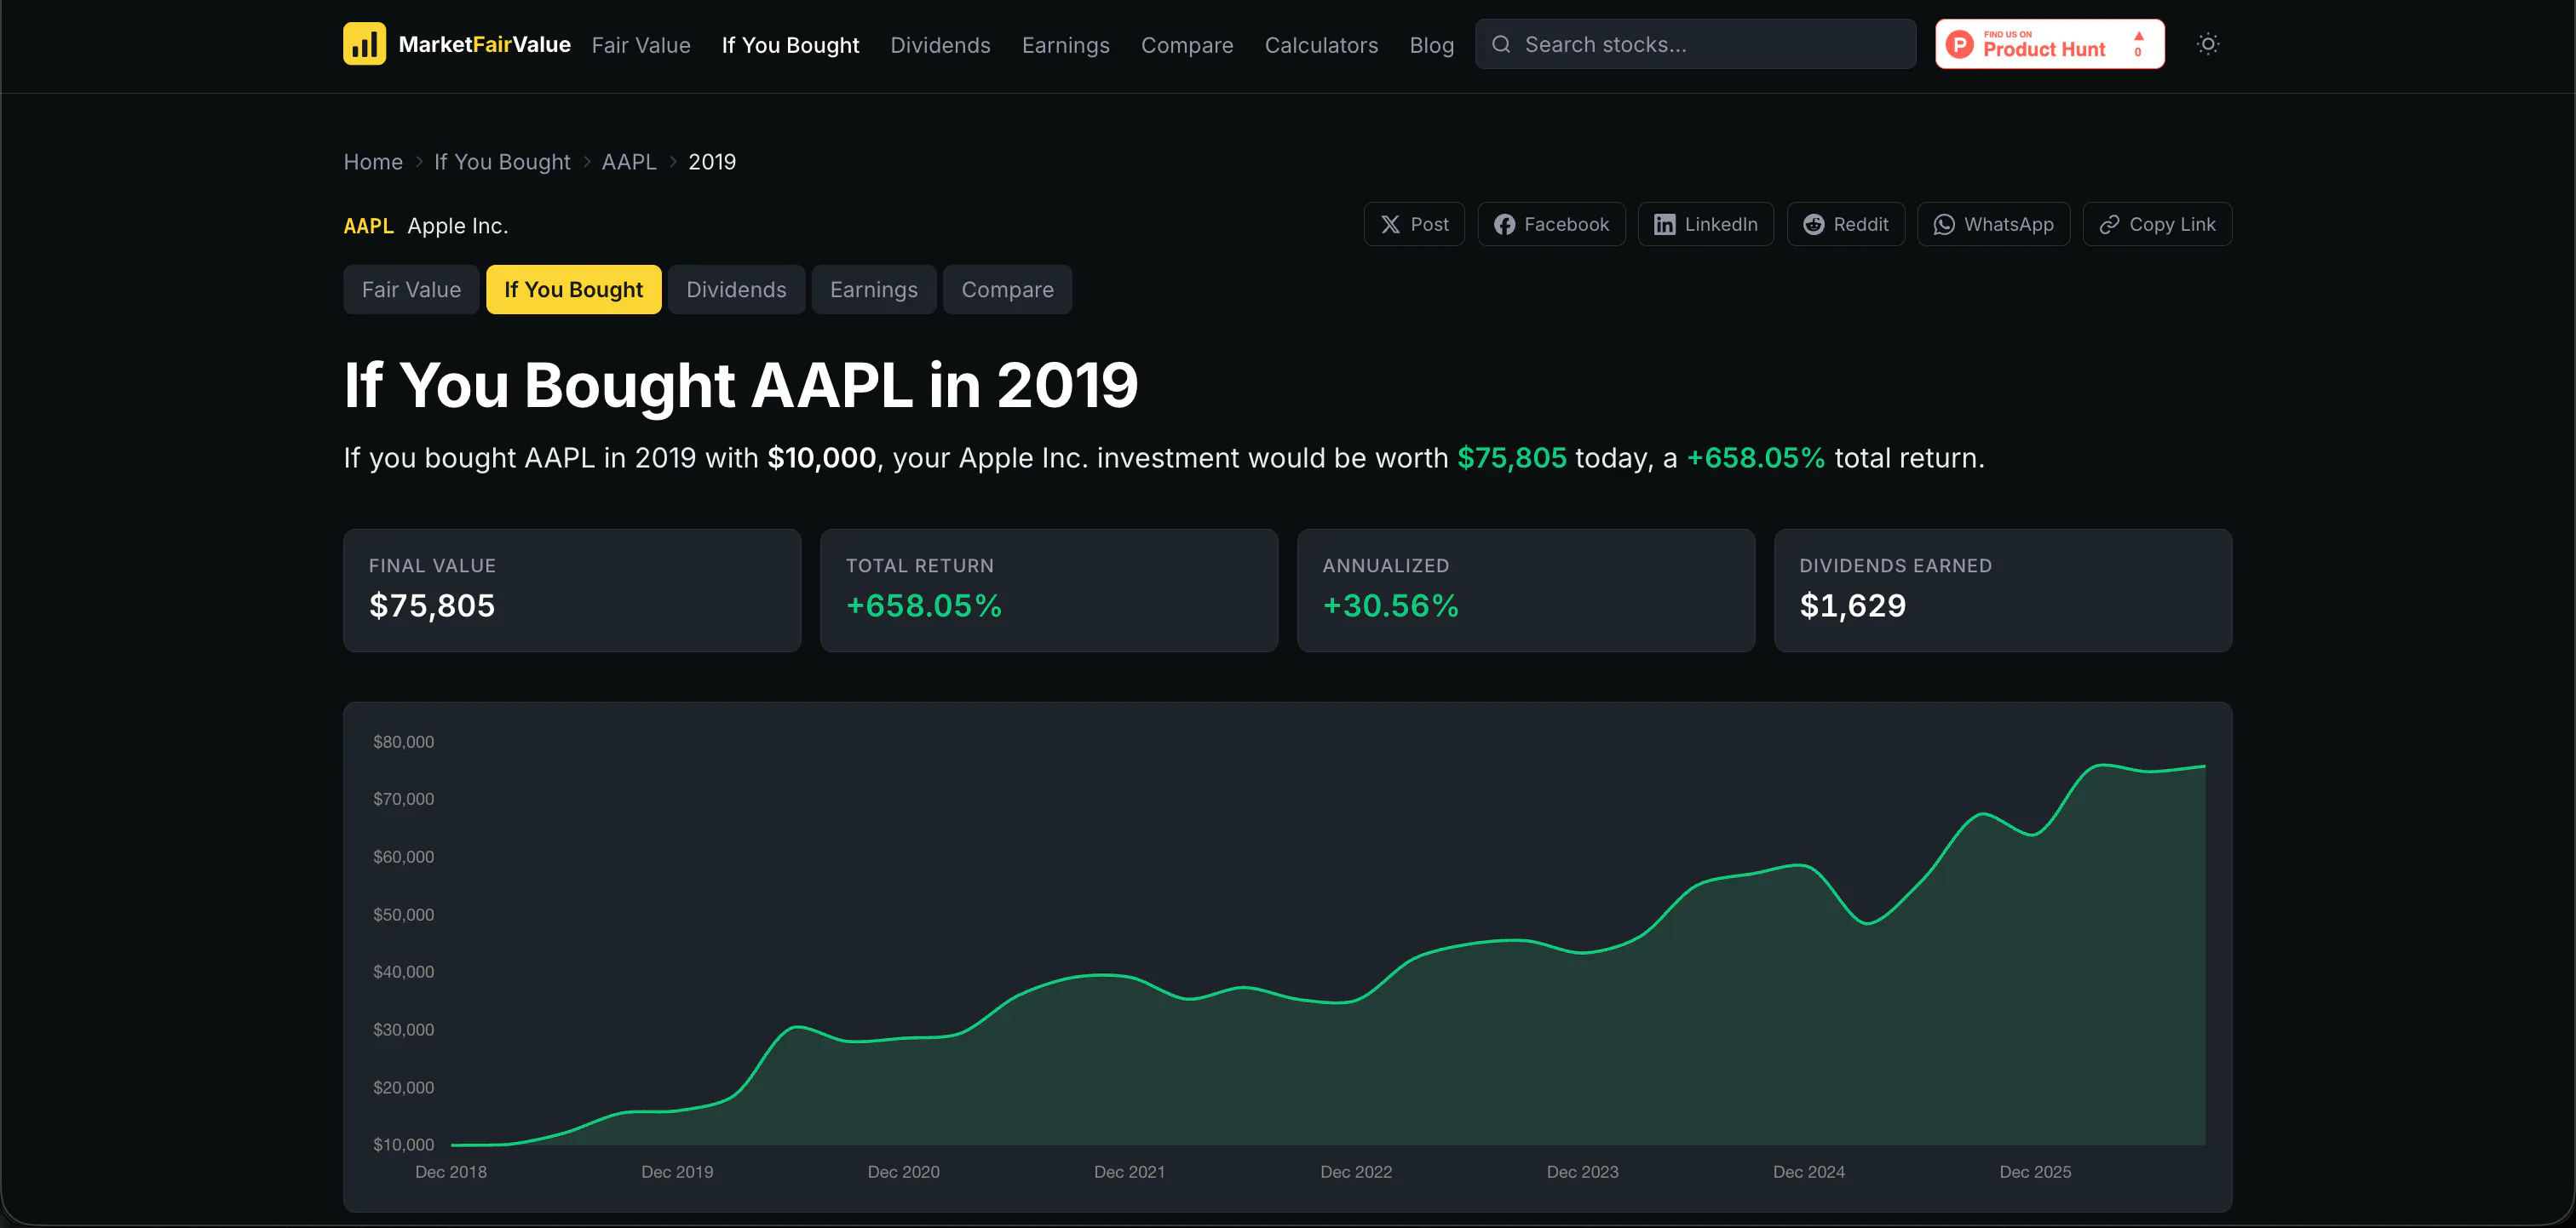
Every stock page also connects five tools in one place: valuation, historical returns with DRIP, dividend planner, earnings countdown, and benchmark comparisons.
And it's genuinely free. No signup wall. No "free tier with limits." No email capture. I use it myself every week and I wanted zero friction.
What's next:
Full S&P 500 coverage (140+ stocks today)
More calculators (CAGR, Margin of Safety)
Whatever you guys ask for
Would love your feedback. What would make this more useful for how you invest? Roast it, suggest things, ask anything.