

Graphy
The fastest way to visualize and share your data.
4.9•12 reviews•2.4K followers
The fastest way to visualize and share your data.
4.9•12 reviews•2.4K followers
At Graphy we’re on a mission to give everyone data superpowers, our goal is to build the easiest to use and most collaborative data visualization platform on the market.
This is the 5th launch from Graphy. View more

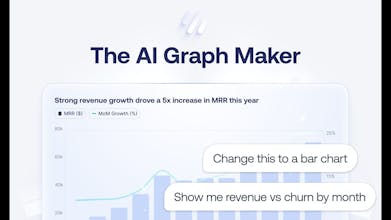
Graphy 3.0
Hate pivot tables? So do we. Graphy is the fastest way to turn messy data into clean, branded, presentation-ready graphs in seconds.


Free Options
Launch Team / Built With


 Chronicle: Cursor for Slides
Hey, thanks for the new release!! As an ex-finance professional used to use Graphy a lot (!) for presenting data to my board: anything related to forecasting, KPIs, etc. As well as part of my presentations, if I needed to tell a story about any of the data.
Ofc also using it for myself as well, as a replacement to the excel built-in visualisations.
The AI enhancement was long overdue. Will play around, have high expectations!
Super bullish on Graphy and team!!
Graphy
@damiank5 thanks Damian!
Colorways Club
I love graphy!! I use it for creating all my internal and external facing charts.
Keep it up!
Graphy
@neil_gandhi2 🔥
Congrats on launching Graphy— the fastest way to turn messy data into stunning visuals, no pivot tables required. This is the tool every over-stuffed spreadsheet has been begging for. I can almost see my prev boss, still clinging to Excel 2010, gasping and falling out of his chair.
GitBook
Congrats on the launch!
Graphy
@valentinoh thank you, Valentino!
Pagecord
Superb work!
Graphy
@lylo ❤️
Congrats on launching Graphy! I run bestofweb .site and love how you turn messy data into storytelling graphs so quickly.
Butter Scenes
LOVE this! Love Graphy as a product - and have used the AI gen extensively. Super impressive.
Graphy
@jakob_knutzen1 🔥 thanks Jakob!