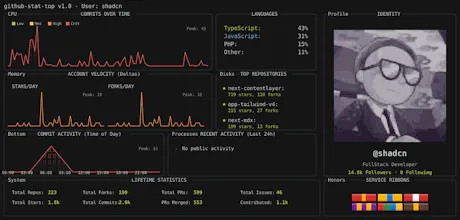
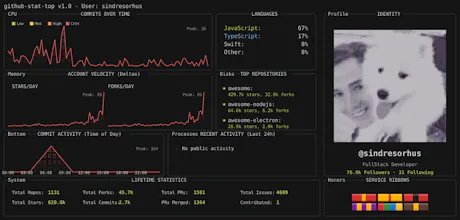
Turn your GitHub Readme into a Command Center. 🚀 Most stats look like trading cards. This looks like a system monitor. It visualizes dev activity as Linux resources: • Commits = CPU Load (Spike graph) • Growth = Memory Usage • Top Repos = Mounted Disks Features a retro, dithered aesthetic perfect for backend devs and Linux enthusiasts. 100% Free & Open Source.
No reviews yetBe the first to leave a review for GitHub Retro Stats API
Maker
📌
Making GitHub profiles look like a Linux terminal 🐧
Hey Product Hunt! 👋
I’m a ECE student and fullstack developer.
We all use tools like htop or btop to monitor our Linux systems. I realized that as developers, our "system performance" is really our code output. So, I built a tool to visualize GitHub activity as if it were system resources.
What it does:
CPU Load: Visualizes your commit history bursts.
Memory: Tracks your account velocity (stars/forks per day).
Disks: Shows your heaviest repositories.
Uptime: (Well, your coding hours).
It’s a simple API call you can drop right into your profile README.md. No configuration needed, just change the username in the URL.
It’s open-source and currently running on a free tier, so be gentle with it! 😅
I’d love to hear what you think or if there are other "system metrics" I should add.
Happy coding!