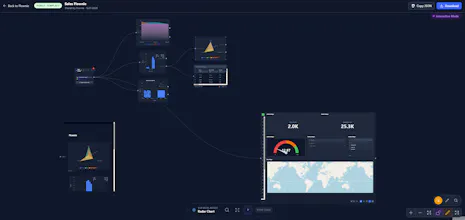
Build powerful data pipelines visually with Flownie. Drag-and-drop interface for data analysis, transformation, and visualization. No coding required. We believe everyone should have access to powerful data analysis tools, regardless of technical expertise.
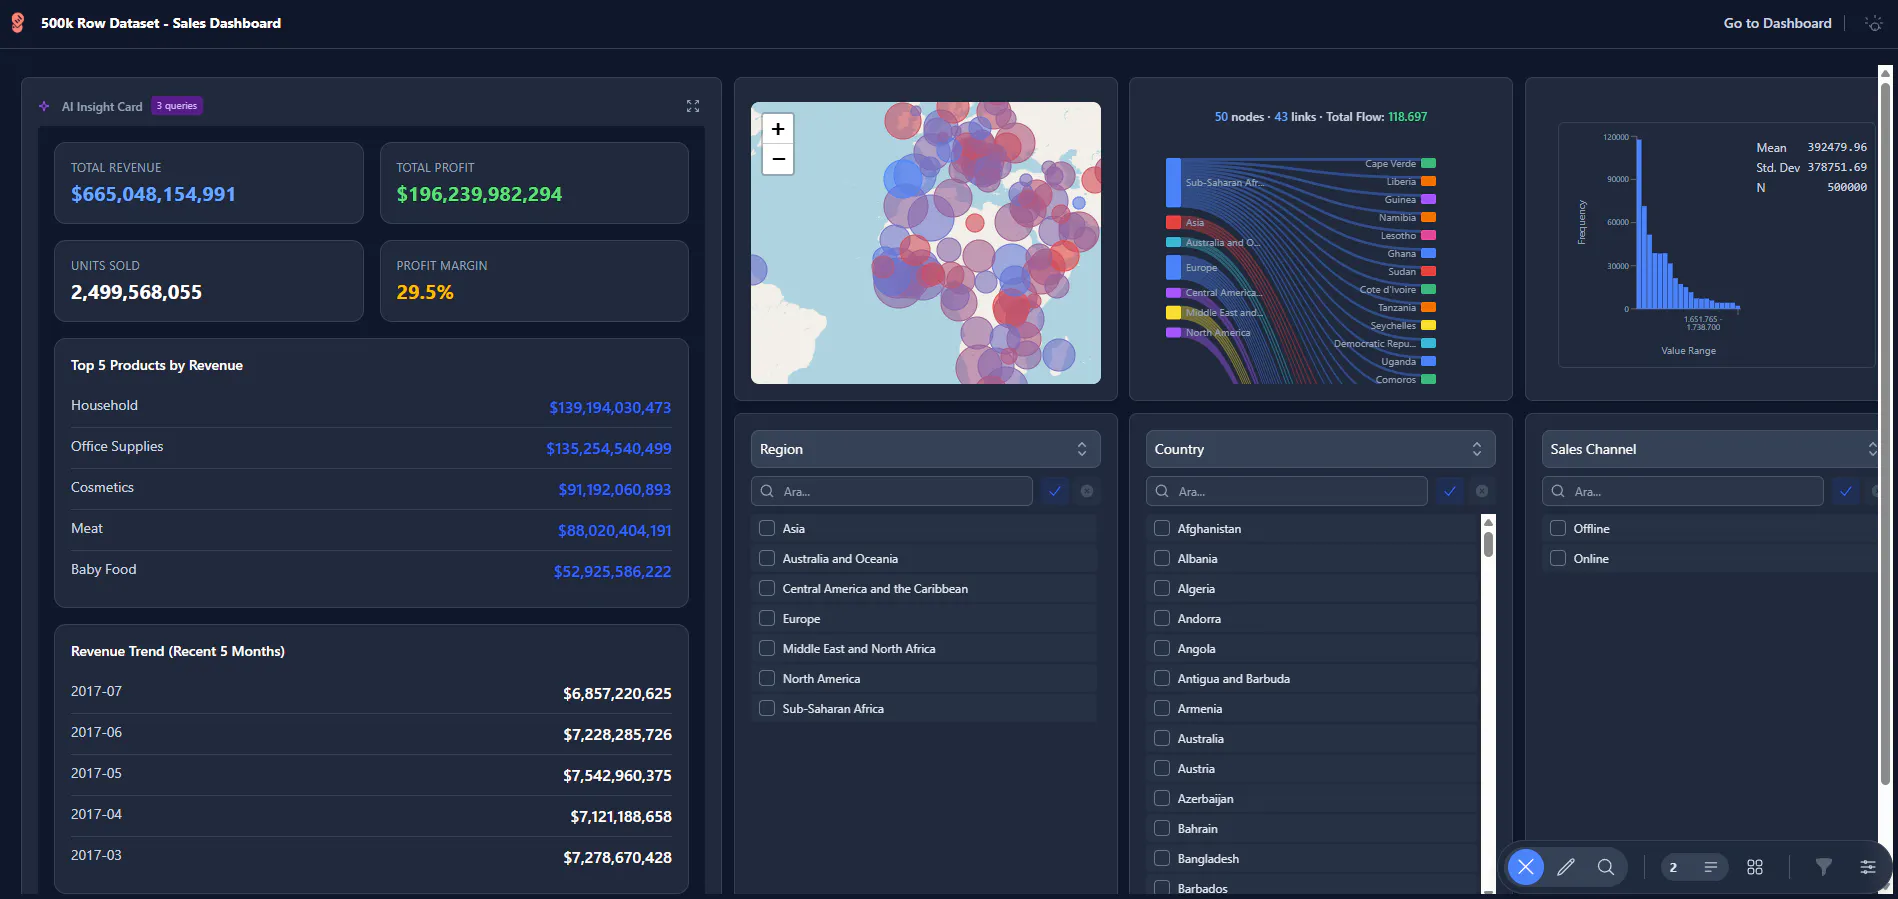
Hello everyone With Flownie, you can analyse 500,000 rows of data and much more directly from a browser tab, whether locally or online Flownie Template 500K
No reviews yetBe the first to leave a review for Flownie
Maker
📌
Flownie was born from the frustration of complex data analysis tools that require extensive technical knowledge. We set out to create a platform that combines the power of professional analytics with the simplicity of visual workflows.
-Making powerful analytics tools available to everyone
-A world where data analysis is accessible to everyone, enabling better decisions and insights across all industries.
-Drag and drop nodes to create powerful data workflows. Connect data sources, transformations, and outputs without writing code.
-Turn your data into beautiful, interactive dashboards. Real-time KPIs, charts, and visualizations that update automatically.
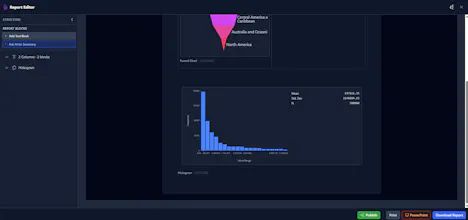
-Let AI analyze your data and generate comprehensive reports. Share insights with your team in one click.
Report
Maker
Since Flownie is constantly evolving, you might catch a few "Beta" bugs along the way. If you need any help, have a feature request, or just want to share the awesome dashboards you built, please reply directly to this post. I read and answer every single one.