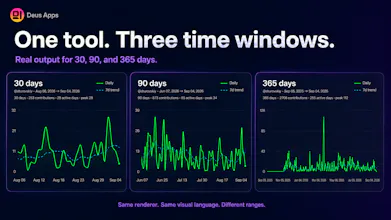
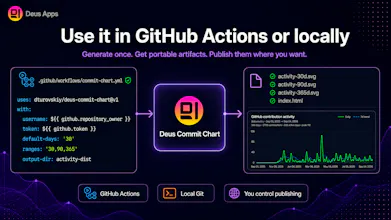
Deus Commit Chart generates static, README-safe GitHub contribution charts as SVGs, with optional interactive HTML reports. It works with GitHub contribution data or local Git history, supports 30/90/365-day ranges, and ships as a reusable GitHub Action. The key idea is simple: your README chart should not depend on a third-party live rendering backend.
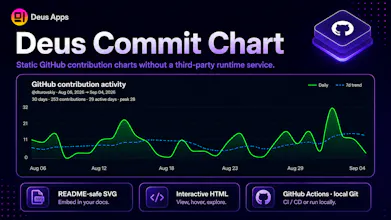
I built Deus Commit Chart after a contribution graph in my GitHub profile started depending on an external rendering service that could fail independently of my README.
Instead of replacing it with another hosted chart API, I wanted the output itself to be something I own: static SVG files that GitHub can render directly.
The project now supports GitHub contribution data and local Git history, 30/90/365-day views, interactive HTML reports, themes, and a reusable GitHub Action.
The main design decision is intentionally boring: generate the artifact during CI, publish it, and let the README reference a static file. No live third-party chart backend is required when somebody opens the profile.
I’d especially appreciate feedback from people maintaining developer profiles, project dashboards, or README automation. What would make this more useful in your workflow?