
Dataello Studio
Beautiful charts in seconds
2 followers
Beautiful charts in seconds
2 followers
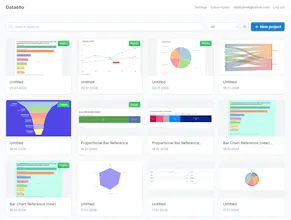
Dataello is a data visualization tool that turns spreadsheets into stunning, interactive charts. Create professional visualizations in seconds — no design skills or coding required. Just paste your data, pick a template, and publish. Perfect for researchers, marketers, and anyone who needs beautiful charts without the learning curve.


🎉 Datello just hit 50 registered users!
When we started building Datello — a simple, powerful data visualization platform — we had one goal: make it ridiculously easy to turn raw data into beautiful, interactive charts. No steep learning curve, no bloated features. Just clean visuals, fast.
Today we crossed a small but meaningful milestone: 50 registered users.
We're still early. Still scrappy. Still shipping fast. But every new sign-up tells us we're solving a real problem — people want a lightweight, modern alternative to tools like Flourish that doesn't get in the way of the story their data is trying to tell.
What's next? More chart types, better customization, and a collaboration layer we're really excited about.
If you work with data and want a tool that respects your time, give Datello a spin. We'd love your feedback. 🚀