codetomap

codetomap

CodeToMap (https://codetomapsakura.streamlit.app/)

3 followers

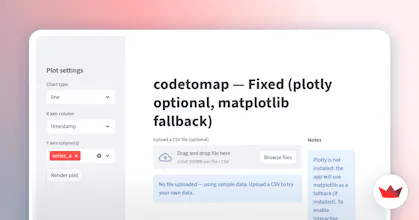
Website Introduction: CodeToMap by Sakura Overview CodeToMap (https://codetomapsakura.streamlit.app/) is a dynamic and innovative web platform developed by Sakura, designed to transform code-based data into interactive and visually engaging maps. Built using the Streamlit framework, this site merges the simplicity of Python programming with the power of modern geographic visualization tools, offering users an intuitive and efficient way to convert structured data into geographical insights.
codetomap gallery image
Free
Launch tags:Tech
Launch Team

What do you think? …

goldensakura
Website Introduction: CodeToMap by Sakura Overview CodeToMap (https://codetomapsakura.streamli...) is a dynamic and innovative web platform developed by Sakura, designed to transform code-based data into interactive and visually engaging maps. Built using the Streamlit framework, this site merges the simplicity of Python programming with the power of modern geographic visualization tools, offering users an intuitive and efficient way to convert structured data into geographical insights. Purpose and Core Concept The main purpose of CodeToMap is to bridge the gap between coding and cartography. It allows developers, data scientists, and GIS enthusiasts to seamlessly visualize location-based data without needing to set up complex mapping environments. Whether the data comes from APIs, CSV files, or direct code input, CodeToMap enables users to quickly render interactive maps that support exploration, presentation, and analysis. Key Features Interactive Map Generation: Users can input data and instantly visualize it as a map with customizable markers, colors, and layers. Multiple Data Input Options: Supports JSON, CSV, and manual input, giving flexibility for different user needs. Real-Time Rendering: The Streamlit backend ensures that maps are generated in real time, providing immediate feedback for data adjustments. Customization Tools: Users can modify styles, adjust zoom levels, and add annotations or labels to enhance clarity and aesthetics. Open and Accessible: Hosted publicly, CodeToMap is free to use and designed with simplicity in mind—ideal for both beginners and professionals. Integration Ready: Because it’s built with Streamlit and Python, it can be integrated into larger data science workflows, APIs, or automation pipelines. Technical Foundation CodeToMap leverages Streamlit for its web interface, combining it with Python’s powerful libraries for data visualization and mapping, such as Folium, Plotly, or Pydeck. These tools enable the rendering of geospatial data directly in the browser without requiring any additional setup. The platform architecture focuses on clarity, scalability, and speed, ensuring that even large datasets can be processed and visualized efficiently. User Experience The website’s interface is minimalist yet functional, emphasizing usability over complexity. The layout guides users through simple steps—from uploading data to viewing the resulting map. CodeToMap’s design ensures accessibility, supporting both desktop and mobile devices. The real-time map preview enhances engagement and learning, especially for users experimenting with geodata visualization. Applications Education: Helps students learn about data visualization and mapping using real datasets. Research: Aids scientists and analysts in presenting geographic trends effectively. Development: Assists developers in prototyping map-based projects rapidly. Business: Enables data-driven decision-making through spatial analytics and visual dashboards. Vision and Future Development Sakura’s vision for CodeToMap extends beyond basic visualization—it aims to become a central hub for interactive, code-driven geospatial analysis. Future updates may include support for 3D maps, real-time API data streaming, enhanced analytics dashboards, and user account systems for saving and sharing projects. Conclusion CodeToMap by Sakura represents the intersection of code and creativity—a space where programming meets geography in an accessible, elegant, and powerful way. It’s not just a mapping tool but a platform that encourages exploration, experimentation, and innovation in data visualization.