
Launching today

claude-devtools
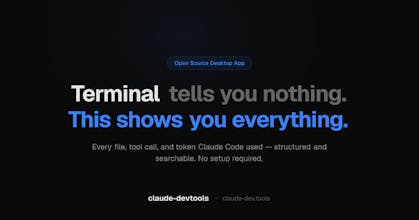
See everything Claude Code hides from your terminal
78 followers
See everything Claude Code hides from your terminal
78 followers
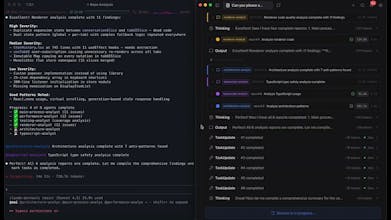
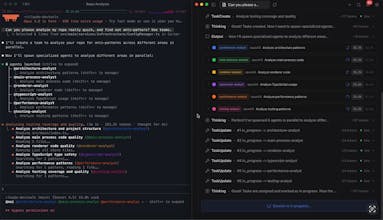
Not another Claude Code GUI wrapper. claude-devtools doesn't run or modify Claude Code — it reads the raw session logs already on your machine and reconstructs everything the CLI hides. Every file path Read, every tool called, every diff Applied, every token consumed — structured into a visual timeline with per-turn context attribution, compaction visualization, subagent execution trees, and custom notification triggers. Works with every session you've ever run. Open source, runs locally.


Hey @matt_1398 congrats on the launch!
> What's your biggest frustration with the Claude CLI right now?
I also like to keep a "tight leash" on Claude/Codex, but besides seeing what has changed I also want to see why it did that. The session log should reflect that, maybe you can find a way to highlight when Claude changes course and why it did that!
@janschutte
Thanks Jan! 🚀 That’s a great question, and it's something I think about a lot too.
Right now, claude-devtools surfaces those extended thinking blocks alongside the tool traces, so you can actually read the reasoning behind each step instead of just seeing the result. When you pair that with the full tool call chain, you can usually piece together why it took a specific path.
But you’re hitting on something deeper: explicitly flagging the "pivot" moments. Whether it’s abandoning an approach or shifting strategy after a tool error, having a dedicated "decision point" marker in the timeline would be a game-changer for observability.
I’m definitely adding that to the roadmap—really appreciate the killer suggestion!
Hey @matt_1398
This is interesting, thanks for building this.
It would be helpful if there could be a convenient progress bar view of the session and weekly % consumption to avoid using /usage
@ashish_tadose
Hey Ashish, thanks for checking it out! 🙌
That’s a really neat idea. Right now, `claude-devtools` is heavily optimized for "post-mortem" debugging—diving deep into the logs of past or recently finished sessions to figure out exactly where the agent went off track.
But I can totally see the value of having a high-level "live dashboard" with a progress bar for your current session or weekly token consumption, just so you don't have to constantly type `/usage` in the CLI.
I’ll definitely add this to the feature backlog and see how I can weave it in. Really appreciate the feedback!
Stellify
This will help me analyse exactly what Claude is doing when working with my MCP tools. Thank you!
@stellify_software
Spot on, Matt! 🙌 MCP debugging is exactly where this tool shines.
When you're building custom MCP tools, the payloads can get massive, and the default CLI often truncates or completely hides the exact JSON inputs/outputs your server is getting.
Being able to visually inspect exactly what Claude is sending to (and receiving from) your MCP tools makes the development loop so much faster.
Would love to hear how it handles your specific MCP setup once you take it for a spin!