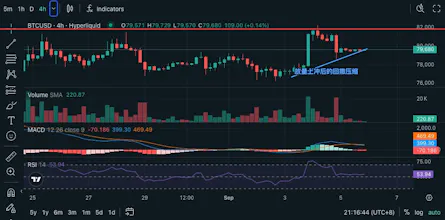
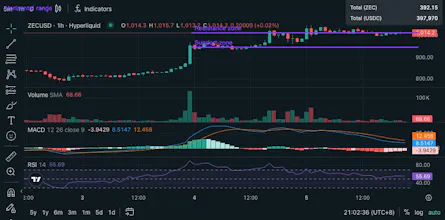
ChartViz turns candlestick charts into clear, evidence-based AI explanations. Use the browser extension on supported charting sites or upload a screenshot to understand market direction, price and volume behavior, indicators, patterns, support and resistance, and potential trade scenarios. Findings appear on annotated charts, so you can see the evidence behind each conclusion. Built for chart research and learning, not trade execution or personalized investment advice.
Hi Product Hunt! 👋
I built ChartViz because most charting tools assume you already understand price action and technical indicators—or give you a conclusion without showing how they reached it.
ChartViz uses AI to turn candlestick charts into clear explanations supported by annotated visual evidence. You can open the browser extension on a supported charting site or upload a screenshot. It examines market structure, price and volume behavior, visible indicators, chart patterns, support and resistance, and conditional long, short, or wait scenarios.
The goal is not to tell people what to buy or sell. It is to help them understand what a chart is showing and why a conclusion was reached. Multi-timeframe analysis connects the broader context, current setup, and lower-timeframe signals in one readable report.
The browser extension is open source, and this is still an early release. I would especially appreciate feedback on:
• Whether the explanations are easy to understand
• Whether the visual annotations match what you see
• Which charting sites we should improve next
Thanks for checking out ChartViz!