
ChartViz
Understand candlestick charts with evidence-based AI
3 followers
Understand candlestick charts with evidence-based AI
3 followers
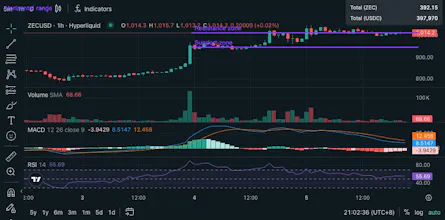
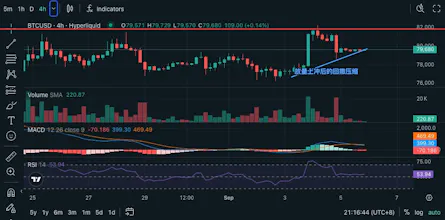
ChartViz turns candlestick charts into clear, evidence-based AI explanations. Use the browser extension on supported charting sites or upload a screenshot to understand market direction, price and volume behavior, indicators, patterns, support and resistance, and potential trade scenarios. Findings appear on annotated charts, so you can see the evidence behind each conclusion. Built for chart research and learning, not trade execution or personalized investment advice.


Free
Launch Team

Framer AI AgentsDesign and publish professional sites with AI
Promoted
