Launched this week

ChartStud
Turn messy data into clear decisions in minutes
115 followers
Turn messy data into clear decisions in minutes
115 followers
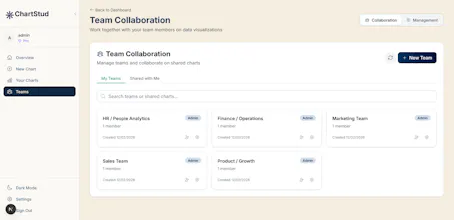
ChartStud helps you turn raw data into beautiful charts, dashboards, and AI-powered insights. Connect your data, clean it automatically, and discover patterns in seconds.


The plain-English to chart flow is compelling. How are you handling ambiguity in prompts so non-technical users still get statistically sound outputs?
ChartStud
@justin_press We’re handling ambiguity in a few ways to keep outputs clear and statistically sound for non-technical users:
Clarifying questions when needed: If a prompt is vague (e.g., “show performance”), ChartStud asks a quick follow-up like which metric, time range, or segment you mean.
Smart defaults: When possible, we apply sensible defaults (e.g., recent time range, most relevant metric) so users still get useful results fast.
Chart + explanation together: Every chart comes with a short explanation of what’s being shown and any assumptions made, so users understand the context.
Guardrails on analysis: We avoid over-interpreting noisy data and surface basic statistical context (like trends vs. outliers) in simple language.
Congrats on the launch! Making analytics feel conversational instead of technical is a strong direction. How does ChartStud handle ambiguous or loosely phrased questions from non-technical users so the generated charts stay accurate and don’t misrepresent the underlying data?
ChartStud
@vik_sh Thanks a lot, Viktor — really appreciate that! 🙌
We handle ambiguity in a few ways to keep charts accurate and avoid misrepresenting data:
Lightweight clarification: If a question is too vague, ChartStud asks a quick follow-up (e.g., which metric, time range, or segment you mean).
Sensible defaults: When possible, we apply safe defaults so users still get fast results without making risky assumptions.
Context + explanations: Each chart comes with a short explanation of what’s being shown and any assumptions made, so users understand the context.
Guardrails on interpretation: We try to avoid over-interpreting noisy data and surface trends vs. outliers in simple terms.